KKP Enterprise Edition (EE) offers optional measuring tools to achieve easier accountability of resources by providing reports about per-cluster or per-namespace CPU and memory utilization. The tool will continuously collect information about all user clusters and create reports containing individual usage values. Report creation can be scheduled individually on a daily basis. The configuration and report files can be easily accessed from the dashboard.
How it works
A metering prometheus instance will be deployed to each seed cluster by the operator. This will collect usage information from the user cluster prometheus instance via federation. The collected information will be saved in the metering prometheus instance for 90 days.
When a scheduled report is executed, data in the metering prometheus instance gets aggregated to create a report from. Generated reports are uploaded to a s3 bucket, from where the reports can be accessed. The dashboard provides a convenient way to list and download all available reports. For that to work properly the s3 endpoint needs to be available from the browser.
Configuration
Prerequisites
- S3 bucket
- Any S3-compatible endpoint can be used
- The bucket is required to store report csv files
- Should be available via browser
- Administrator access to dashboard
- Administrator access can be gained by
- asking other administrators to follow the instructions for Adding administrators via the dashboard
- or by using kubectl to give a user admin access. Please refer to the Admin Panel documentation for instructions
- Administrator access can be gained by
Configuration from the Dashboard
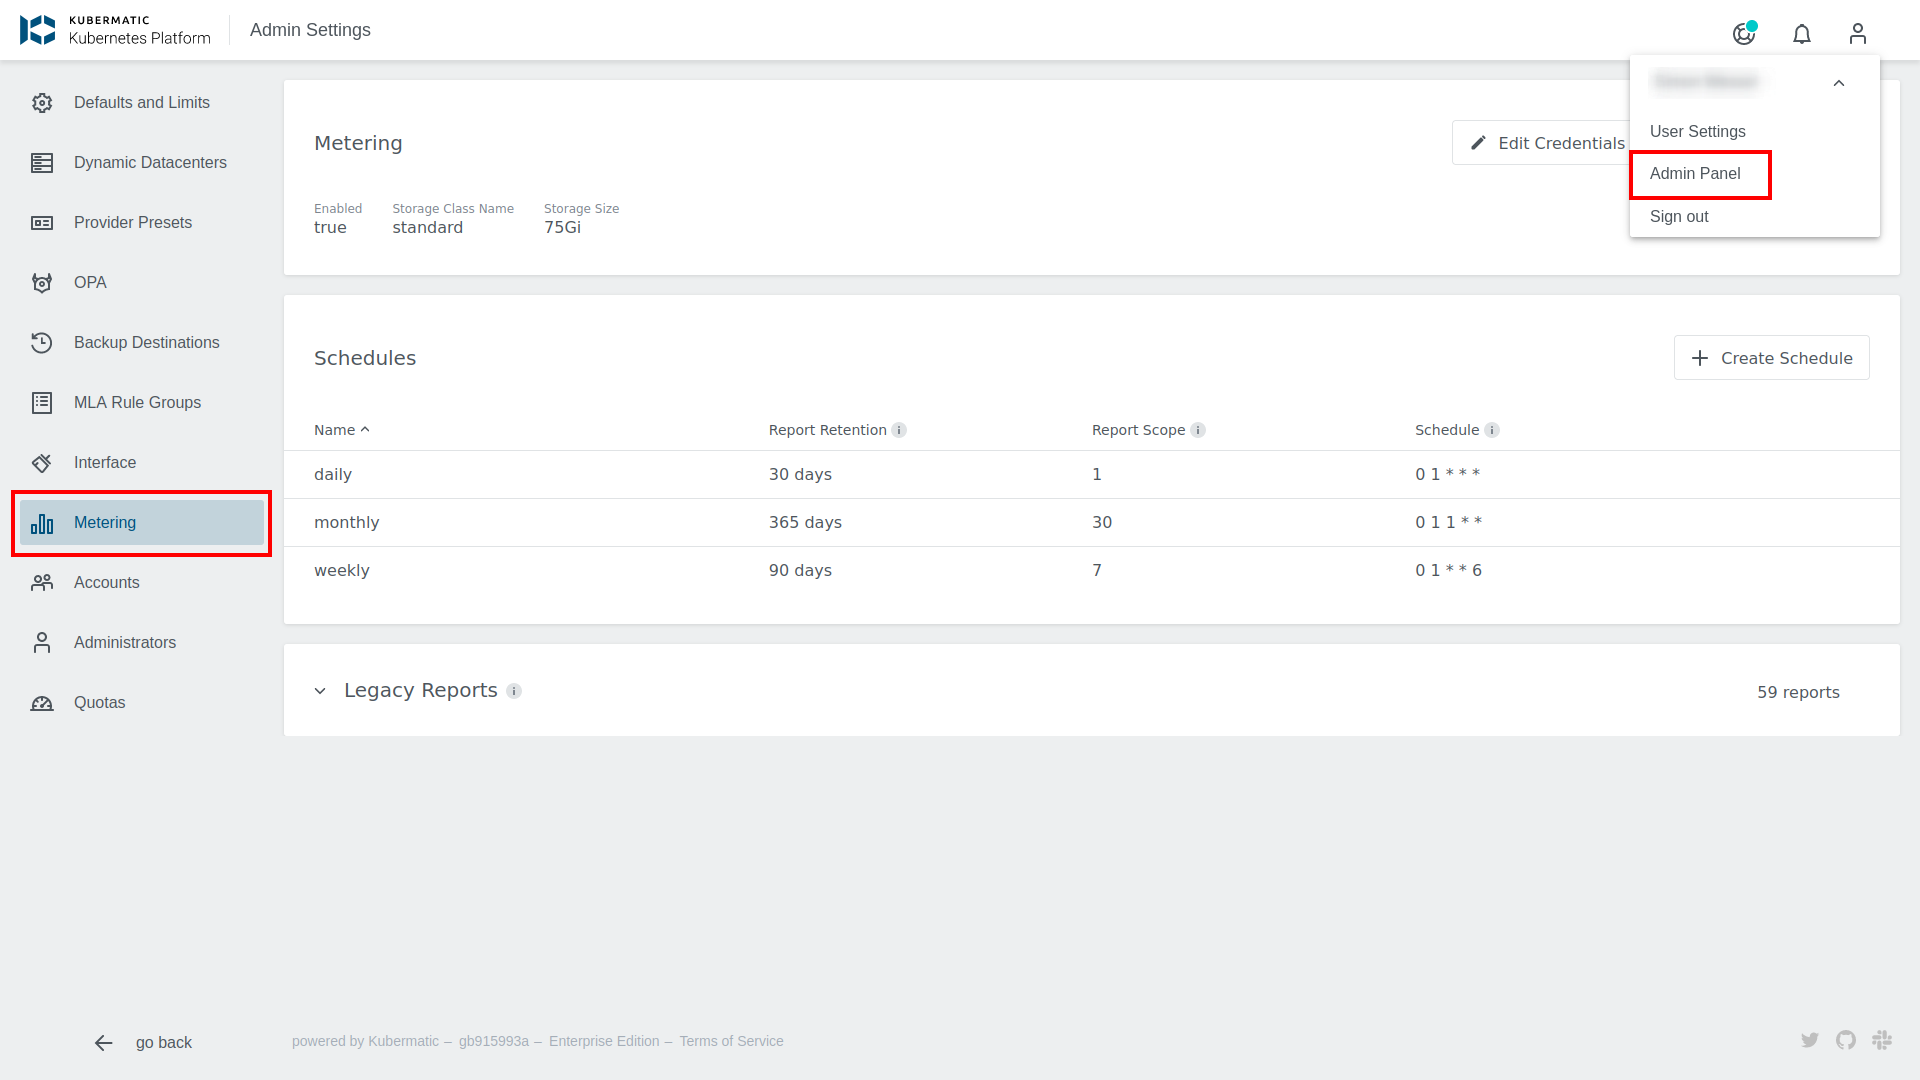
Using the dashboard, configuring the Metering tool becomes a breeze. Open the Admin Panel and choose the Metering tab on the left side.

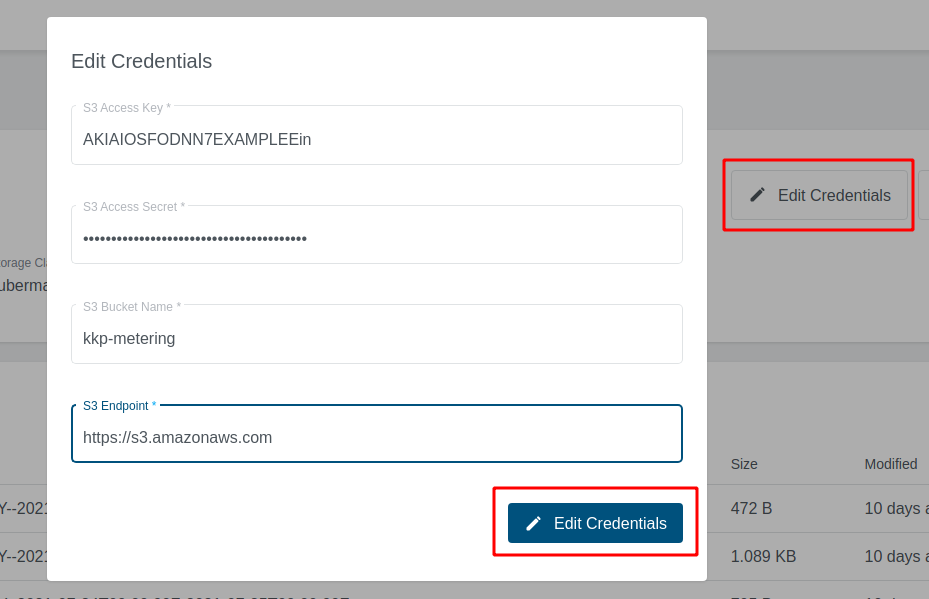
First you need to configure the credentials for your S3 bucket. To do so click on Edit credentials, fill in the credential fields and confirm with the button below.
- S3 Access Key and S3 Access Secret
- Security credentials for your S3 bucket
- S3 Endpoint
- Address to your S3 service
- If you are using Amazon S3, you may use
https://s3.amazonaws.com
- S3 bucket
- Name of your S3 bucket

The next step is to enable metering. Click on Configure Metering, switch on Enable Metering and change the configuration options according to your wishes.
Enable metering- Switch to turn metering on or off
storageClassName- Storage Class for the PersistentVolume, that will store the metering data
- You may use
kubermatic-fastor any other storage class you have configured
storageSize- The size that will be used for your
PersistentVolume - You may use a plain integer value (bytes) or a human-readable string like
50Gi. See the Kubernetes Docs for a more thorough explanation of valid values - When choosing a volume size, please take into consideration that old usage data files will not be deleted automatically
- The size that will be used for your
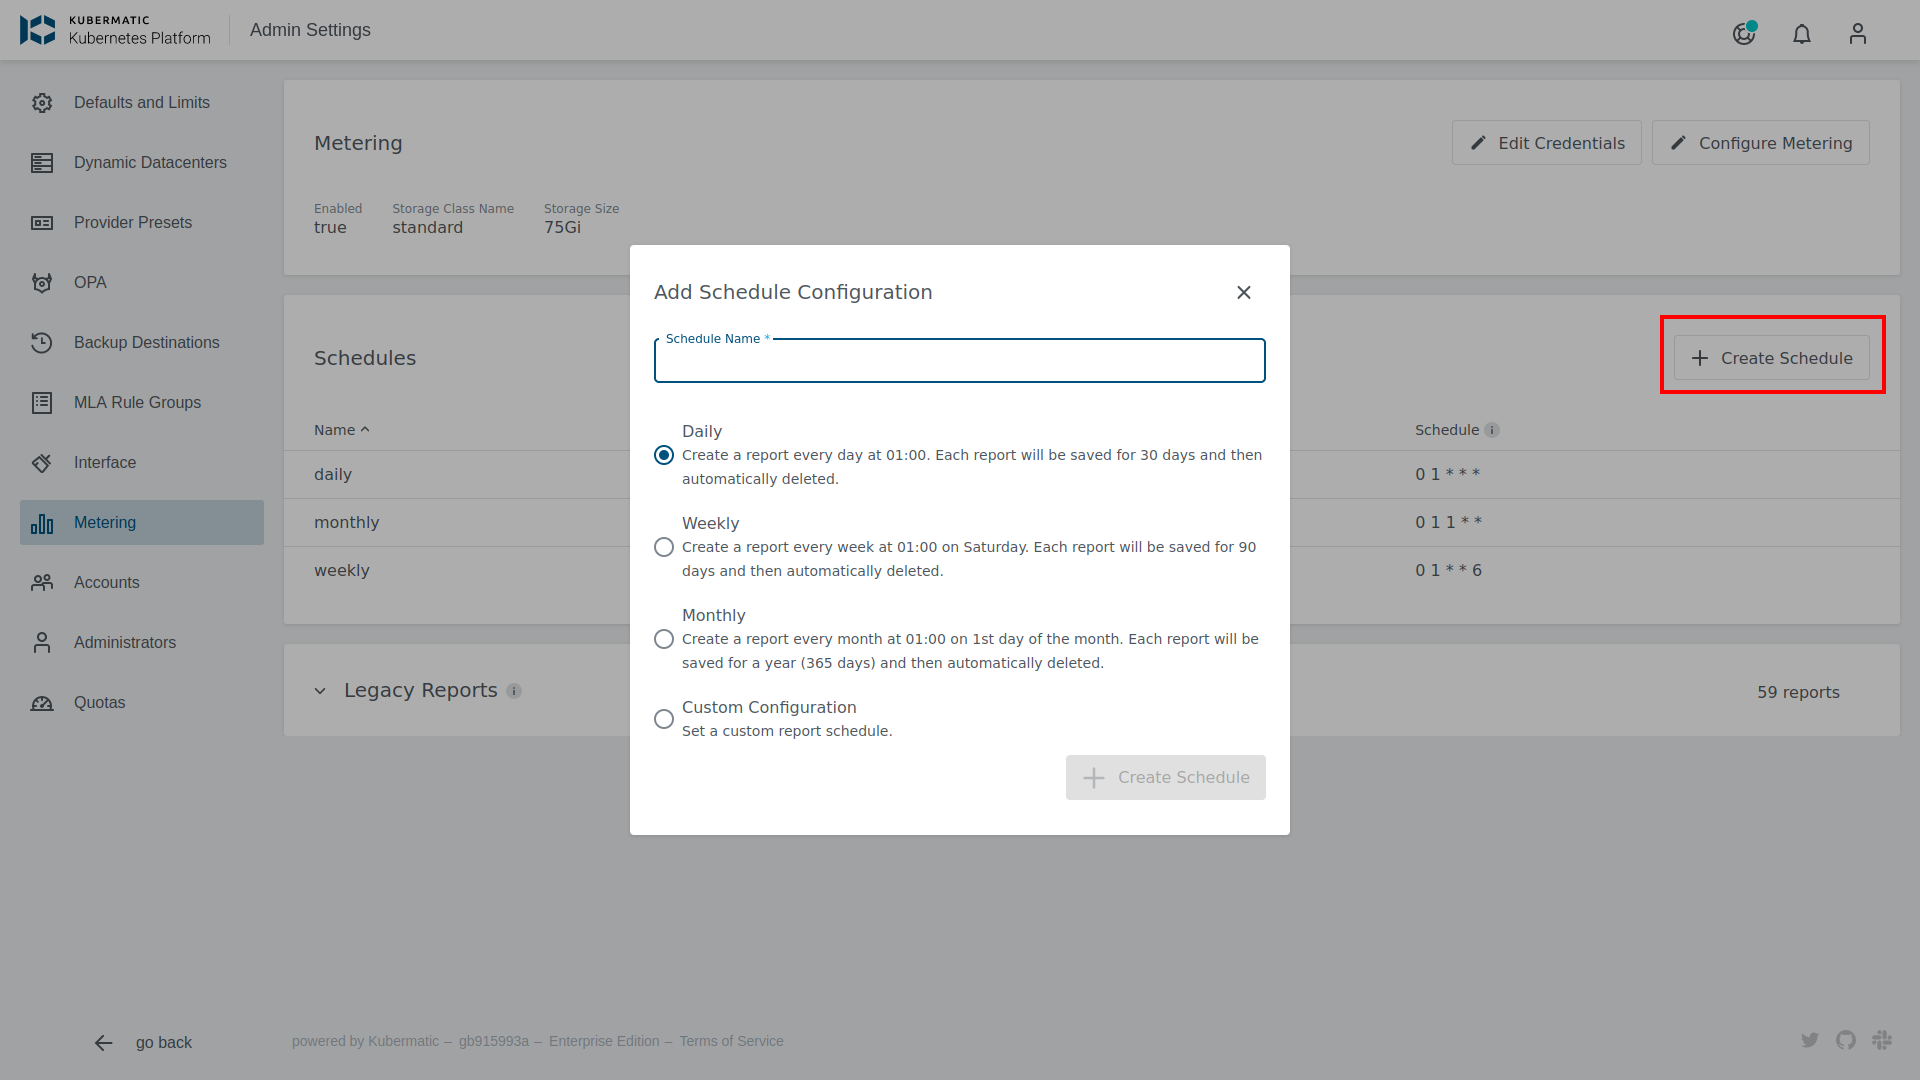
In the end it is possible to create different report schedules. Click on Create Schedule, to open the Schedule configuration dialog.
Below to the three predefined Schedules it is possible to create a custom schedule. A schedule consist of four different values to set:
Schedule Name- Name of the Schedule. This is also used as a folder name to store generated reports.
Report retention- Number of days each report is saved, leave the field empty to store reports forever. This will set a retention period at the s3 Backend.
Report scope- Number of days captured in each report.
Cron Expression- Cron expression that describes how often a report should be created.

Configuration via Seed Object
It is possible to set Metering values directly at the Seed. This allows enabling Metering only for specific Seeds.
For S3 report synchronization, it is mandatory to create a secret with the following values:
apiVersion: v1
kind: Secret
metadata:
 name: metering-s3
 namespace: kubermatic
data:
 accessKey: ""
 bucket: ""
 endpoint: ""
 secretKey: ""
Metering Seed configuration reference:
apiVersion: kubermatic.k8c.io/v1
kind: Seed
spec:
  metering:
    enabled: true
    # StorageClassName is the name of the storage class that the metering prometheus instance uses to store metric data for reporting.
    storageClassName: ""
    # StorageSize is the size of the storage class. Default value is 100Gi.
    storageSize: 100Gi
    reports:
      weekly:
        interval: 7
        schedule: 0 1 * * 6
        # Types of reports to generate. Available report types are cluster and namespace. By default, all types of reports are generated.
        type:
          - Cluster
          - Namespace
Reports
Reports will be provided as CSV files. The file names include the reporting interval.
Data used to aggregate the report are stored in a prometheus instance dedicated to metering. It will delete entries older than 90days. This metering prometheus instance collects data from user clusters via federation. Originally they are collected from kubelet and cAdvisor. Metrics used to aggregate to a report are as follows:
- machine_controller_machines_total
- node_cpu_usage_seconds_total
- machine_cpu_cores
- machine_memory_bytes
- node_memory_working_set_bytes
- container_cpu_usage_seconds_total
- container_memory_working_set_bytes
Metrics are used to calculate an average value for the time period of the report.
CPU values are converted to milliCPU Memory values are converted to bytes
Accessing Reports
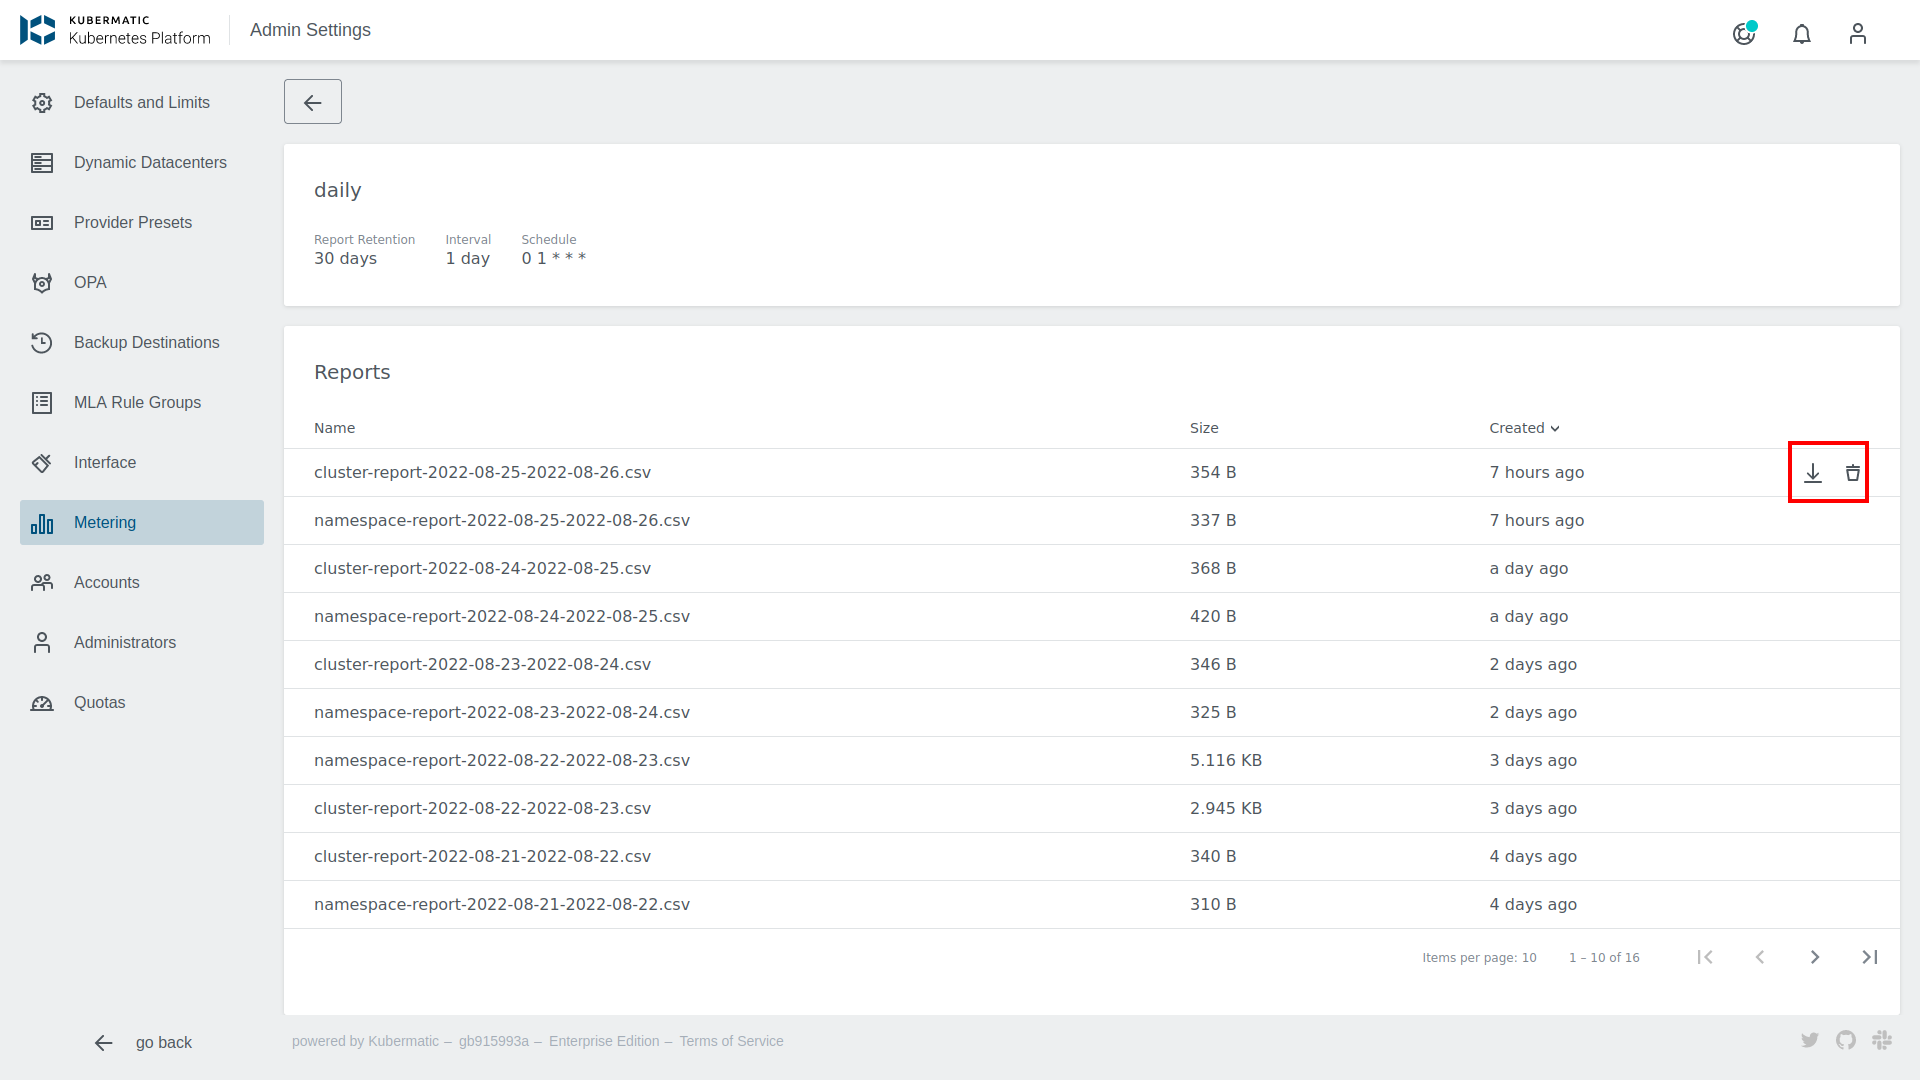
While the reports will be stored in your S3-bucket, they can also be accessed from the dashboard. The metering overview provides a list of all reports. Click on the download button on the right side to save a specific report file.

Cluster Report
Report consist information on a per cluster level.
Kubelet Metrics:
- node_cpu_usage_seconds_total
- node_memory_working_set_bytes
- machine_cpu_cores
- machine_memory_bytes
Machine controller Metrics:
- machine_controller_machines_total
The following values will be written to the reports:
- Project name
- Project ID
- Project labels
- Cluster name
- Cluster ID
- Cluster labels
- Average available CPU cores (deprecated, likely to be removed in future releases)
- Total used CPU seconds (deprecated, likely to be removed in future releases)
- Average available memory bytes
- Average used memory bytes
- Average number of used nodes
- Created at (timestamp in RFC 3339 format)
- Deleted at (timestamp in RFC 3339 format)
- Average Cluster Machines
- Average available CPU millicores
- Average used cpu millicores
Namespace Report
Report consist information on a per namespace level.
Kubelet Metrics:
- container_cpu_usage_seconds_total
- container_memory_working_set_bytes
The following values will be written to the reports:
- Project name
- Project ID
- Project labels
- Cluster name
- Cluster ID
- Cluster labels
- Namespace name
- Total used CPU seconds (deprecated, likely to be removed in future releases)
- Average used memory bytes
- Average used cpu millicores
Raw data
The data used to aggregate the reports can be accessed via the metering prometheus instance. If you desire to store this data for longer than 90days, you need to extract the data from the metering prometheus instance and replicate it to a long term storage of your choice.