The User Cluster MLA (Monitoring Logging & Alerting) stack for KKP provides integrated monitoring, logging & alerting functionality for applications and services running in KKP user clusters. When enabled for a user cluster, users can easily access logs & metrics and configure alerts for their user clusters from a central place, without the need for installation of any additional software.
Unlike the Master / Seed Cluster MLA stack, it is focused solely on user clusters and applications running in them, not on monitoring the KKP platform itself. That said, it still provides some view into system services running in user clusters, such as coredns, CNI pods, and user cluster KKP components.
Use Cases
Monitoring of common applications in user clusters: Many applications commonly deployed into user clusters, such as well known Ingress controllers, proxies, web backends or databases already provide endpoints with metrics in Prometheus format. Very often, these are even enabled by default, and annotated with prometheus.io/scrape annotations. If that is the case, those metrics will be automatically discovered by user cluster Prometheus and made available in the MLA Grafana UI without any further configuration.
Monitoring of custom / legacy applications in user clusters: Even if the applications running in the Seed Clusters do not provide metrics in Prometheus format, they can still be monitored using their logs. Thanks to Loki’s versatility, labels can be extracted from log lines of any application and even used to generate alerts (see the blog post: Transform logs as you’re querying them, and set up alerts within Loki).
Monitoring of user cluster worker nodes: Thanks to the Node Exporter plugin for Prometheus, the user cluster MLA stack can be also used for monitoring of hardware and OS metrics of user cluster worker nodes.
Monitoring of system resources in user clusters: The KKP Master / Seed Cluster MLA Stack can be used for monitoring of pods running in the Master and Seed clusters, which also includes the control plane of User Clusters that runs in Seed (apiserver, etcd, machine-controller, KKP usercluster-controller, etc.). However, in user clusters, there are also some system components that are worth monitoring - typically all pods running in the kube-system namespace, such as coredns, CNI pods, and user cluster KKP components. These can be monitored using the User CLuster MLA stack.
Architecture
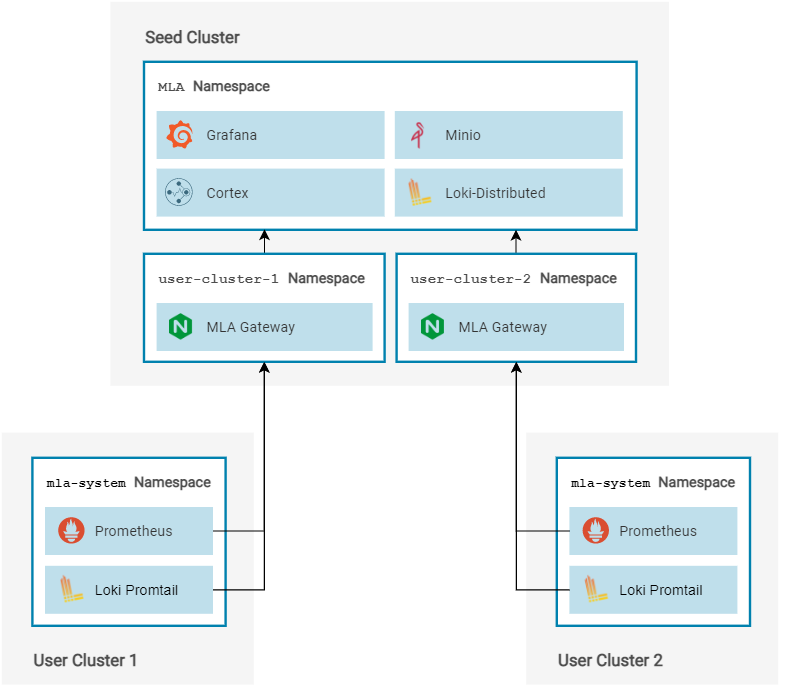
User Cluster Components
When User Cluster MLA is enabled in a KKP user cluster, it automatically deploys two components into it - Prometheus and Loki Promtail. These components are configured to stream (remote write) the logs and metrics into backends running in the Seed Cluster (Cortex for metrics and Loki-Distributed for logs). The connection between the user cluster components and Seed cluster components is secured by HTTPS with mutual TLS certificate authentication.
This makes the MLA setup in user clusters very simple and low footprint, as no MLA data is stored in the user clusters and user clusters are not involved when doing data lookups. Data of all user clusters can be accessed from a central place (Grafana UI) in the Seed Cluster.
Seed Cluster Components
As mentioned above, metrics and logs data from all user clusters are streamed into their Seed Cluster, where they are processed and stored in a long term object store (Minio). Data can be looked up in a multi-tenant Grafana instance which is running in the Seed, and provides each user a view to metrics and logs of all clusters which they have privileges to access in the KKP platform.
MLA Gateway: The entrypoint for the data on the write path (coming from the user clusters) is the MLA Gateway. For higher security and flexibility, each user cluster has a dedicated instance (or possibly multiple instances) of the MLA Gateway in their respective user cluster namespace in Seed (where the rest of the control plane for the user cluster is running as well). The MLA Gateway is responsible for the following:
- terminating TLS sessions with logs/metrics streams from the user clusters,
- mTLS authentication,
- adding HTTP headers with tenant ID (KKP Cluster ID) to individual data streams to ensure proper multi-tenancy,
- potentially rate-limiting of requests, or temporarily disabling the request flow from a user cluster.
Cortex: The backend for processing, storing and retrieving metrics data from user Cluster Clusters is based on the Cortex project with Blocks Storage. It is a horizontally scalable, highly available, multi-tenant backend for Prometheus metrics. As part of its components, it also provides a multi-tenant Alertmanager that is used in KKP for managing alerts on a per user cluster basis. For more information about Cortex architecture, please refer to the Cortex Block Storage Architecture documentation.
Loki-Distributed: The backend for processing, storing and retrieving logs data from user Cluster Clusters is based on the Loki - distributed deployment. It allows horizontal scalability of individual Loki components that can be fine-tuned to fit any use-case. For more details about Loki architecture, please refer to the Loki Architecture documentation.
Installation
Please follow the User Cluster MLA Stack Admin Guide.