The Master / Seed Cluster MLA (Monitoring Logging & Alerting) stack monitors KKP components running in the KKP master and seed clusters, including control plane components of the user clusters. Unlike the User Cluster MLA stack it does not monitor applications running in the user clusters. Only KKP administrators can access this monitoring data.
It uses Prometheus and its Alertmanager for monitoring and alerting. The logging stack consists of Promtail and Grafana Loki. Dashboarding is done with Grafana.
Overview
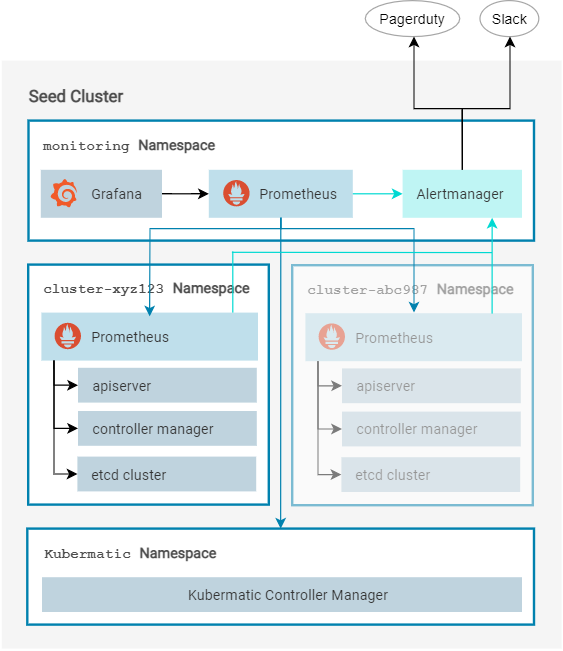
There is a single Prometheus service in each seed cluster’s monitoring namespace, which is responsible for monitoring the cluster’s components (like the KKP controller manager) and serves as the main datasource for the accompanying Grafana service. Besides that there is a Prometheus inside each user cluster namespace, which in turn monitors the Kubernetes control plane (apiserver, controller manager, etcd cluster etc.) of that customer cluster. The seed-level Prometheus scrapes all customer-cluster Prometheus instances and combines their metrics for creating the dashboards in Grafana.
Along the seed-level Prometheus, there is a single alertmanager running in the seed, which all Prometheus instances are using to relay their alerts (i.e. the Prometheus inside the customer clusters send their alerts to the seed cluster’s alertmanager).
Federation
The seed-level Prometheus uses Prometheus’ native federation mechanism to scrape the customer Prometheus instances. To prevent excessive amount of data in the seed, it will however only scrape a few selected metrics, namely those labelled with kubermatic=federate.
The last of these options is used for pre-aggregated metrics, which combine highly detailed time series (like from etcd) into smaller, easier to handle metrics that can be readily used inside Grafana.
Grafana
In a default KKP installation we ship Grafana as readonly metrics dashboard. When working with Grafana please keep in mind, that ALL CHANGES done using the Grafana UI (like adding datasources, etc.) WILL NOT BE PERSISTED. Dashboards, graphs, datasources, etc. will be defined using the Helm chart.
Storage Requirements
Depending on how user clusters are used, disk usage for Prometheus can vary greatly. As the operator you should however plan for
- 100 MiB used by the seed-level Prometheus for each user cluster
- 50-300 MiB used by the user-level Prometheus, depending on its WAL size.
These values can also vary if you tweak the retention periods.
Installation
Please follow the Installation of the Master / Seed MLA Stack Guide.