This page contains an administrator guide for the User Cluster MLA Stack. The user guide is available at User Cluster MLA User Guide page.
Installation
The User Cluster MLA stack components have to be manually installed into every KKP Seed cluster.
Requirements
At the minimal scale (to process MLA data from several user clusters), the stack requires the following resources in the seed cluster:
- 2 vCPUs
- 14 GB of RAM
Apart from that, it will claim the following storage from the kubermatic-fast storage class:
- 50 Gi volume for MinIO (object store for logs, metrics, and alertmanager configurations, etc.)
- 10 Gi volume for Grafana
- 10 Gi volume for each Ingester instance (3 Loki Ingesters + 3 Cortex Ingesters by default)
- 10 Gi volume for Loki Querier
- 4 x 2 Gi volume for other internal processing services (compactors, store gateways of Cortex and Loki)
Capacity planning
The most important part of resources consumption of the MLA stack belongs to the storage and computing power used by Cortex and it’s components. For specific information about estimating the resource usage, please refer to Cortex capacity planning documentation.
Some key parameters to consider are:
- The number of active series
- Sampling rate
- The rate at which series are added and removed
- How compressible the time-series data are
Other parameters which can become important if you have particularly high values:
- Number of different series under one metric name
- Number of labels per series
- Rate and complexity of queries
Installing MLA Stack in a Seed Cluster
Create MLA secrets
If you are upgrading MLA from older version, do not reinstall/upgrade the mla-secrets chart, unless instructed to do so in the release notes.
The kubermatic/mla Github repository contains all the Helm charts of the User Cluster MLA stack and scripts to install them. Clone or download it, so that we can deploy the MLA stack into a KKP Seed cluster. Please make sure you are using the tag that is matching your KKP version as described in the “KKP Compatibility Matrix”.
Before deploying the MLA stack into the KKP Seed cluster, let’s create two Kubernetes Secrets that contain credentials for MinIO and Grafana, and which will be used by the MLA stack and KKP controllers. The MLA repo contains a Helm chart that will auto-generate the necessary Secrets - for creating them, simply run:
helm --namespace mla install --atomic --create-namespace mla-secrets charts/mla-secrets --values config/mla-secrets/values.yaml
The above command will create two Secrets (one for MinIO, and one for Grafana), if you want to use your existing Secrets in the Cluster, you can disable the creation by modifying the mla-secret value.yaml
Deploy Seed Cluster Components
After the secrets are created, the MLA stack can be deployed by using the helper script:
./hack/deploy-seed.sh
Please note: this helper script uses yq version 4.x and jq in addition to helm. Refer to the section below for full list of available options:
--skip-minio               this can be used if you want to configure MLA backend components to user existing minio in the cluster, if this flag is not specified, it will deploy a minio instance for you.
--skip-minio-lifecycle-mgr this will skip the installation of minio lifecycle manager.
--skip-dependencies        this will skip downloading dependencies for the charts from external repositories
--download-only            this will only download the dependencies without installing MLA stack
This will deploy all MLA stack components with the default settings, which may be sufficient for smaller scale setups (several user clusters). If any customization is needed for any of the components, the steps in the helper script can be manually reproduced with tweaked Helm values. See the “Setup Customization” section for more information.
Also, this will deploy a MinIO instance which will be used by MLA components for storage. If you would like to reuse an existing MinIO instance in your cluster or other S3-compatible srevices from cloud providers, please refer to Setting up MLA with Existing MinIO or Other S3-compatible Services.
Setup Seed Cluster Components for High Availability
By default, Cortex and Loki are deployed for high-availability, but Grafana is not. If you want to set up Grafana for high availability, you just need to set up a shared database for storing dashboard, users and other persistent data. For more details, please refer to the official HA guide setup guide.
Expose Grafana & Alertmanager UI
After deploying MLA components into a KKP Seed cluster, Grafana and Alertmanager UI are exposed only via ClusterIP services by default. To expose them to users outside of the Seed cluster with proper authentication in place, we will use the IAP Helm chart from the Kubermatic repository.
As a matter of rule, to integrate well with KKP UI, Grafana and Alertmanager should be exposed at the URL https://<any-prefix>.<seed-name>.<kkp-domain>, for example:
https://grafana.<seed-name>.<kkp-domain>https://alertmanager.<seed-name>.<kkp-domain>
The prefixes chosen for Grafana and Alertmanager then need to be configured in the KKP Admin Panel Configuration to enable KKP UI integration.
Let’s start with preparing the values.yaml for the IAP Helm Chart. A starting point can be found in the config/iap/values.example.yaml file of the MLA repository:
- Modify the base domain under which your KKP installation is available (
kkp.example.cominiap.oidc_issuer_url). - Modify the base domain, seed name and Grafana prefix as described above (
grafana.seed-cluster-x.kkp.example.cominiap.deployments.grafana.ingress.host). - Set
iap.deployments.grafana.client_secret+iap.deployments.grafana.encryption_keyandiap.deployments.alertmanager.client_secret+iap.deployments.alertmanager.encryption_keyto the newly generated key values (they can be generated e.g. withcat /dev/urandom | tr -dc A-Za-z0-9 | head -c32). - Configure how the users should be authenticated in
iap.deployments.grafana.configandiap.deployments.alertmanager.config(e.g. modifyYOUR_GITHUB_ORGandYOUR_GITHUB_TEAMplaceholders). Please check the OAuth Provider Configuration for more details. - Make the corresponding changes for the Alertmanager config as well.
It is also necessary to set up your infrastructure accordingly:
- Configure your DNS with the DNS entry for the domain name that you used in
iap.deployments.grafana.ingress.hostandiap.deployments.alertmanager.ingress.hostso that it points to the ingress-controller service of KKP. - Configure the Dex in KKP with the proper configuration for Grafana and Alertmanager IAP, e.g. using the following snippet that can be placed into the KKP values.yaml. Make sure to modify the
RedirectURIswith your domain name used iniap.deployments.grafana.ingress.hostandiap.deployments.alertmanager.ingress.hostand secret with youriap.deployments.grafana.client_secretandiap.deployments.alertmanager.client_secret:
dex:
  clients:
  - RedirectURIs:
    - https://grafana.seed-cluster-x.kkp.example.com/oauth/callback
    id: mla-grafana
    name: mla-grafana
    secret: YOUR_CLIENT_SECRET
  - RedirectURIs:
    - https://alertmanager.seed-cluster-x.kkp.example.com/oauth/callback
    id: mla-alertmanager
    name: mla-alertmanager
    secret: YOUR_CLIENT_SECRET
At this point, we can install the IAP Helm chart into the mla namespace, e.g. as follows:
helm --namespace mla upgrade --atomic --create-namespace --install iap charts/iap --values config/iap/values.yaml
For more information about how to secure your services in KKP using IAP and Dex, please check Securing System Services Documentation.
Setup
Once the User Cluster MLA stack is installed in all necessary seed clusters, it needs to be configured as described in this section.
Enabling MLA Feature in KKP Configuration
Since the User Cluster MLA feature is in alpha stage, it has to be explicitly enabled via a feature gate in the KubermaticConfiguration, e.g.:
apiVersion: kubermatic.k8c.io/v1
kind: KubermaticConfiguration
metadata:
  name: kubermatic
  namespace: kubermatic
spec:
  featureGates:
    UserClusterMLA: true
Enabling MLA Stack in a Seed
Since the MLA stack has to be manually installed into every KKP Seed Cluster, it is necessary to explicitly enable it on the Seed Cluster level after it is installed. This can be done via mla.userClusterMLAEnabled option of the Seed Custom Resource / API object, e.g.:
apiVersion: kubermatic.k8c.io/v1
kind: Seed
metadata:
  name: europe-west3-c
  namespace: kubermatic
spec:
  mla:
    userClusterMLAEnabled: true
Admin Panel Configuration
There are several options in the KKP “Admin Panel” which are related to user cluster MLA, as shown on the picture below:
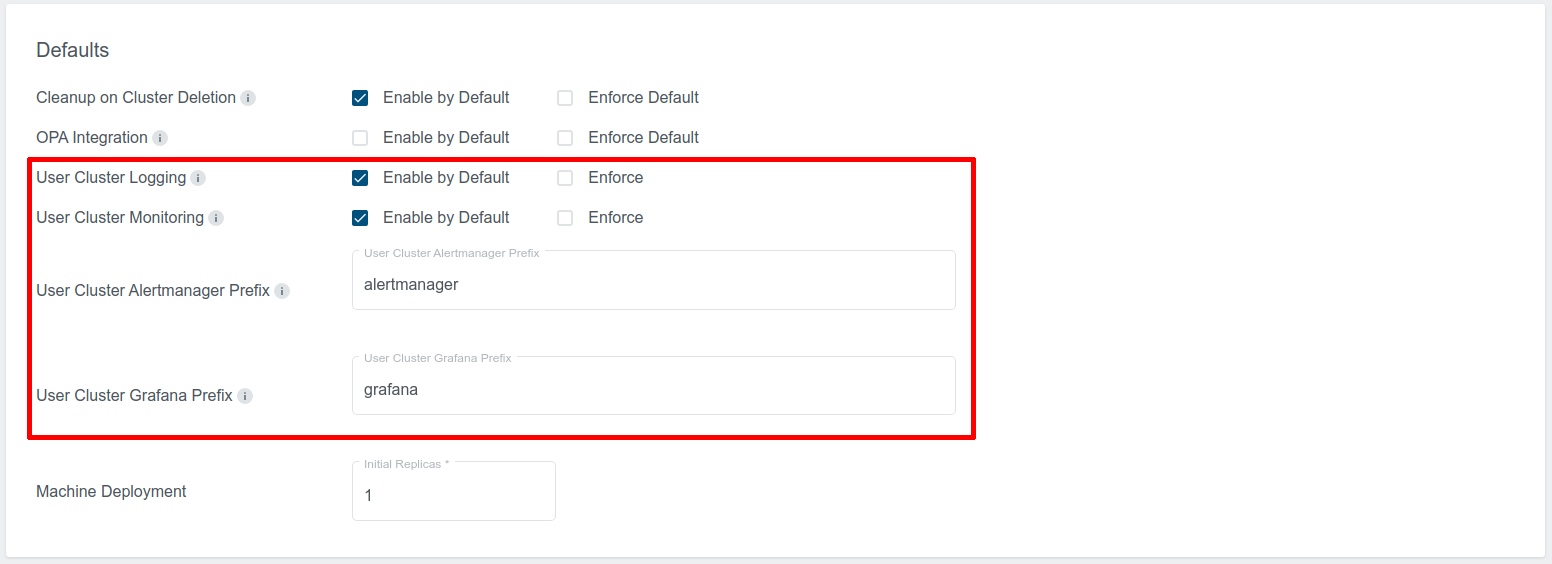
User Cluster Logging:
- Enabled by Default: If this checkbox is selected, User Cluster Logging will be enabled by default in the cluster creation page.
- Enforce: If this is selected, User Cluster Logging will be enabled by default, and users will not be able to change it.
User Cluster Monitoring:
- Enabled by Default: If this checkbox is selected, User Cluster Monitoring will be enabled by default in the cluster creation page.
- Enforce: If this is selected, User Cluster Monitoring will be enabled by default, and users will not be able to change it.
User Cluster Alertmanager Prefix:
- Domain name prefix on which the User Cluster Alertmanager will be exposed to KKP users. It has to be the same prefix that has been used during the MLA stack installation in the Seed cluster (see Expose Grafana & Alertmanager UI).
- Seed name and the base domain under which KKP is running will be appended to it, e.g. for prefix
alertmanagerthe final URL would behttps://alertmanager.<seed-name>.<kkp-domain>.
User Cluster Grafana Prefix:
- Domain name prefix on which the User Cluster Grafana will be exposed to KKP users. It has to be the same prefix that has been used during the MLA stack installation in the Seed cluster (see Expose Grafana & Alertmanager UI).
- Seed name and the base domain under which KKP is running will be appended to it, e.g. for prefix
grafanathe final URL would behttps://grafana.<seed-name>.<kkp-domain>.
Addons Configuration
KKP provides several addons for user clusters, that can be helpful when the User Cluster Monitoring feature is enabled, namely:
- node-exporter addon: exposes hardware and OS metrics of worker nodes to Prometheus,
- kube-state-metrics addon: exposes cluster-level metrics of Kubernetes API objects (like pods, deployments, etc.) to Prometheus.
When these addons are deployed to user clusters, no further configuration of the user cluster MLA stack is needed, the exposed metrics will be scraped by user cluster Prometheus and become available in Grafana automatically.
Before addons can be deployed into KKP user clusters, the KKP installation has to be configured to enable them
as accessible addons. The node-exporter and kube-state-metrics
addons are part of the KKP default accessible addons, so they should be available out-of-the box, unless the KKP installation
administrator has changed it.
Enabling alerts for MLA stack in a Seed
To enable alerts in seed cluster for user cluster MLA stack(cortex and loki) , update the values.yaml used for installation of Master / Seed MLA stack. Add the following line under prometheus.ruleFiles label:
- /etc/prometheus/rules/usercluster-mla-*.yaml
With this update in values.yaml, we can now upgrade the Prometheus chart:
Helm 3
helm --namespace monitoring upgrade --install --wait --values /path/to/your/helm-values.yaml prometheus charts/monitoring/prometheus/
Operation
Setup Customization
The default settings of the MLA stack components are sufficient for smaller scale setups (several user clusters). Whenever a larger scale is needed these settings should be adapted accordingly.
User Cluster MLA stack components setting can be adapted by modifying (using your own) their value.yaml files. Available Helm chart options can be reviewed in the MLA repo:
For larger scales, you will may start with tweaking the following:
- Size of the object store used to persist metrics data and logs (minio
values.yaml-persistence.size) - default: 50Gi - Storage & Data Retention Settings (see the next chapter)
- Cortex Ingester replicas (cortex values.yaml -
ingester.replicas) - default 3 - Cortex Ingester volume sizes (cortex values.yaml -
ingester.persistentVolume.size) - default 10Gi - Loki Ingester replicas (loki values.yaml -
ingester.replicas) - default 3 - Loki Ingester volume sizes (loki values.yaml -
ingester.persistentVolume.size) - default 10Gi
For more details about configuring these components in an HA manner, you can review the following links:
Cortex:
Loki:
Grafana:
Storage & Data Retention Settings
By default, the MLA stack is configured to hold the logs and metrics in the object store for 7 days. This can be overridden for logs and metrics separately:
For the metrics:
- In the cortex Helm chart values.yaml, set
config.limits.max_query_lookbackto the desired value (default:168h= 7 days). - In the minio-lifecycle-mgr Helm chart values.yaml, set
lifecycleMgr.buckets[name=cortex].expirationDaysto the value used in the cortex Helm chart + 1 day (default:8d).
For the logs:
- In the loki Helm chart values.yaml, set
loki.config.chunk_store_config.max_look_back_periodto the desired value (default:168h= 7 days). - In the minio-lifecycle-mgr Helm chart values.yaml, set
lifecycleMgr.buckets[name=loki].expirationDaysto the value used in the loki Helm chart + 1 day (default:8d).
Setting up MLA with Existing MinIO or Other S3-compatible Services
By default, a MinIO instance will also be deployed as the S3 storage backend for MLA components. It is also possible to use an existing MinIO instance in your cluster or any other S3-compatible services.
There are three Helm charts which are related to MinIO in MLA repository:
- mla-secret is used to create and manage MinIO and Grafana credentials Secrets.
- minio is used to deploy MinIO instance in Kubernetes cluster.
- minio-lifecycle-mgr is used to manage the lifecycle of the stored data, and to take care of data retention.
If you want to disable the MinIO installation and use your existing MinIO instance or other S3 services, you need to:
- Disable the Secret creation for MinIO in mla-secret Helm chart. In the mla-secret Helm chart values.yaml, set
minio.enabledtofalse. - Modify the S3 storage settings in
values.yamlof other MLA components to use the existing MinIO instance or other S3 services:- In cortex Helm chart values.yaml, change the
config.ruler.storage.s3,config.alertmanager.storage.s3, andconfig.blocks_storage.s3to point to your MinIO instance. Modify theruler.env,storage_gateway.env,ingester.env,querier.envandalertmanager.envto get credentials from your Secret. - In loki Helm chart values.yaml, change the
storage_config.awsandruler.storage.s3in theloki.configto point to your MinIO instance or S3 service. ModifyextraEnvFromoftableManager,ingester,querier,rulerandcompactorto get credentials from your Secret. - If you still want to use MinIO lifecycle manager to manage data retention for MLA data in your MinIO instance, in minio-lefecycle-mgr Helm chart values.yaml, set
lifecycleMgr.minio.endpointandlefecycleMgr.minio.secretNameto your MinIO endpoint and Secret.
- In cortex Helm chart values.yaml, change the
- Use
--skip-minioor--skip-minio-lifecycle-mgrflag when you execute./hack/deploy-seed.sh. If you want to disable MinIO but still use MinIO lifecycle manager to take care of data retention, you can use--skip-minioflag. Otherwise, you can use both flags to disable both MinIO and lifecycle manager.
Managing Grafana Dashboards
In the User Cluster MLA Grafana, there are several predefined Grafana dashboards that are automatically available across all Grafana organizations (KKP projects). The KKP administrators have ability to modify the list of these dashboards.
There are three ways for managing them:
Modify the already existing (pre-created) configmaps with the
grafana-dashboardsprefix in themlanamespace in the Seed cluster. These configmaps contain the Grafana dashboards that are already available across all KKP projects. You can add or remove Dashboards by modifying these configmaps. Be aware that these changes can be overwritten by MLA stack upgrade.Create a new configmap with the
grafana-dashboardsname prefix in themlanamespace in the Seed cluster. You can add multiple such configmaps with your dashboards json data. For example:
apiVersion: v1
kind: ConfigMap
metadata:
  name: grafana-dashboards-example
  namespace: mla
data:
  example-dashboard.json: <your-dashboard-json-data>
- Add dashboards to the User Cluster MLA Grafana Helm chart values. You can add dashboards into the
dashboardssection of the values.yaml file.
After the new dashboards are applied to the Seed Cluster, they will become available across all Grafana Organizations, and they can be found in the Grafana UI under Dashboards -> Manage.
Managing Alerting and Recording Rules
Similar to managing Grafana Dashboards, KKP administrators can also pre-define Prometheus-compatible rules for metrics and logs and make them automatically available across all KKP user clusters with MLA enabled.
Rule groups can be managed via the following API endpoints, which are only available for KKP administrator users:
GET /api/v2/seeds/{seed_name}/rulegroups- list rule groupsGET /api/v2/seeds/{seed_name}/rulegroups/{rulegroup_id}- get rule groupPOST /api/v2/seeds/{seed_name}/rulegroups- create rule groupPUT /api/v2/seeds/{seed_name}/rulegroups/{rulegroup_id}- update rule groupDELETE /api/v2/seeds/{seed_name}/rulegroups/{rulegroup_id}- delete rule group
Rate-Limiting
In order to prevent from denial of service by abusive users of misconfigured applications, the write path and read path of the User Cluster MLA stack can be configured with rate-limits per user cluster.
Rate-limiting can be configured via the following API endpoints of MLAAdminSetting - available only for KKP administrator users:
GET /api/v2/projects/{project_id}/clusters/{cluster_id}/mlaadminsetting- get admin settingsPOST /api/v2/projects/{project_id}/clusters/{cluster_id}/mlaadminsetting- create admin settingsPUT /api/v2/projects/{project_id}/clusters/{cluster_id}/mlaadminsetting- update admin settingsDELETE /api/v2/projects/{project_id}/clusters/{cluster_id}/mlaadminsetting- delete admin settings
By default, no rate-limiting is applied. Configuring the rate-limiting options with zero values has the same effect.
For metrics, the following rate-limiting options are supported as part of the monitoringRateLimits:
| Option | Direction | Enforced by | Description |
|---|---|---|---|
ingestionRate | Write path | Cortex | Ingestion rate limit in samples per second (Cortex ingestion_rate). |
ingestionBurstSize | Write path | Cortex | Maximum number of series per metric (Cortex max_series_per_metric). |
maxSeriesPerMetric | Write path | Cortex | Maximum number of series per this user cluster (Cortex max_series_per_user). |
maxSeriesTotal | Write path | Cortex | Maximum number of series per this user cluster (Cortex max_series_per_user). |
queryRate | Read path | MLA Gateway | Query request rate limit per second (NGINX rate in r/s). |
queryBurstSize | Read path | MLA Gateway | Query burst size in number of requests (NGINX burst). |
maxSamplesPerQuery | Read path | Cortex | Maximum number of samples during a query (Cortex max_samples_per_query). |
maxSeriesPerQuery | Read path | Cortex | Maximum number of timeseries during a query (Cortex max_series_per_query). |
For logs, the following rate-limiting options are supported as part of the loggingRateLimits:
| Option | Direction | Enforced by | Description |
|---|---|---|---|
ingestionRate | Write path | MLA Gateway | Ingestion rate limit in requests per second (NGINX rate in r/s). |
ingestionBurstSize | Write path | MLA Gateway | Ingestion burst size in number of requests (NGINX burst). |
queryRate | Read path | MLA Gateway | Query request rate limit per second (NGINX rate in r/s). |
queryBurstSize | Read path | MLA Gateway | Query burst size in number of requests (NGINX burst). |
Debugging
This chapter describes some potential problems that you may face in a KKP installation and the steps you can take to resolve then.
Prometheus / Loki datasource for an user cluster is not available in the Grafana UI:
- Make sure you are switched to the proper Grafana Organization (see the “Switch between Grafana Organizations” section of this documentation)
- Make sure that user cluster Monitoring / Logging is enabled for the user cluster (In KKP UI, you should see green checkboxes on the Cluster Page):
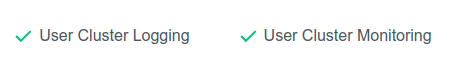
Metrics / Logs are not available in Grafana UI for some user cluster:
- Make sure that User Cluster Monitoring / Logging is enabled for the user cluster (In KKP UI, you should see green checkboxes on the Cluster Page):
- Check that Prometheus / Promtail was deployed an is running in the user cluster:
kubectl get pods -n mla-system
Output will be similar to this:
NAME                          READY   STATUS    RESTARTS   AGE
prometheus-68f7485456-jj7v6   1/1     Running   0          11m
promtail-cm4qd                1/1     Running   0          6m11s
- Check the logs of Prometheus / Promtail pods
- Check that the MLA Gateway pod is running in the user cluster namespace in the Seed cluster:
kubectl get pods -n cluster-cxfmstjqkw | grep mla-gateway
Output will be similar to this:
mla-gateway-6dd8c68d67-knmq7 1/1 Running 0 22m
- Check the logs of the MLA Gateway pods
- Check the status of the pods in the
mlanamespace in the seed cluster:
kubectl get pods -n mla
- If there are any pods crashing, review their logs for the root cause
Uninstallation
Before proceeding with any of the following steps, make sure that you backup all data that you may still need - metrics data / logs in the object store, alertmanager / rules configuration, Grafana dashboards.
In order to uninstall the User Cluster MLA stack from a seed cluster (and all user clusters serviced by that seed cluster), follow the 3 steps in this order:
- Disable the User Cluster MLA feature in Seed configuration
- Remove the User Cluster MLA components from Seed
- Remove the User Cluster MLA data from Seed
Disabling the User Cluster MLA in Seed Configuration
In order to disable the User Cluster MLA feature for a Seed Cluster, set the mla.userClusterMLAEnabled option of the Seed Custom Resource / API object to false, e.g.:
apiVersion: kubermatic.k8c.io/v1
kind: Seed
metadata:
  name: europe-west3-c
  namespace: kubermatic
spec:
  mla:
    userClusterMLAEnabled: false
Removing the User Cluster MLA Components
In order to uninstall the user cluster MLA stack components from a Seed cluster, first disable it in the Seed Custom Resource / API object as described in the previous section. After that, you can safely remove the resources in the mla namespace of the Seed Cluster.
You can do that on per-component basis using Helm - see the list of the helm Charts in the mla namespace:
helm ls -n mla
E.g. to uninstall Cortex, run:
helm delete cortex -n mla
Upgrade
To incorporate the helm-charts upgrade, follow the below steps:
Upgrade Loki to version 2.4.0
Add the following configuration inside loki.config key, under ingester label in the Loki’s values.yaml file:
wal:
  dir: /var/loki/wal
Upgrade Cortex to version 1.9.0
Statefulset store-gateway refers to a headless service called cortex-store-gateway-headless, however, due to a bug in the upstream helm-chart(v0.5.0), the cortex-store-gateway-headless doesn’t exist at all, and headless service is named cortex-store-gateway, which is not used by the statefulset. Because cortex-store-gateway is not referred at all, we can safely delete it, and do helm upgrade to fix the issue (Refer to this pull-request for details).
Delete the existing cortex-store-gateway service by running the below command:
kubectl delete svc cortex-store-gateway -n mla
After doing the above-mentioned steps, MLA stack can be upgraded using the helper-script:
./hack/deploy-seed.sh