This chapter covers the basic monitoring and health overview capabilities provided with the Master/Seed Monitoring Stack using the default Grafana dashboards. All screenshots below were taken from live Grafana instance installed with Kubermatic Kubernetes Platform.
Dashboard categories
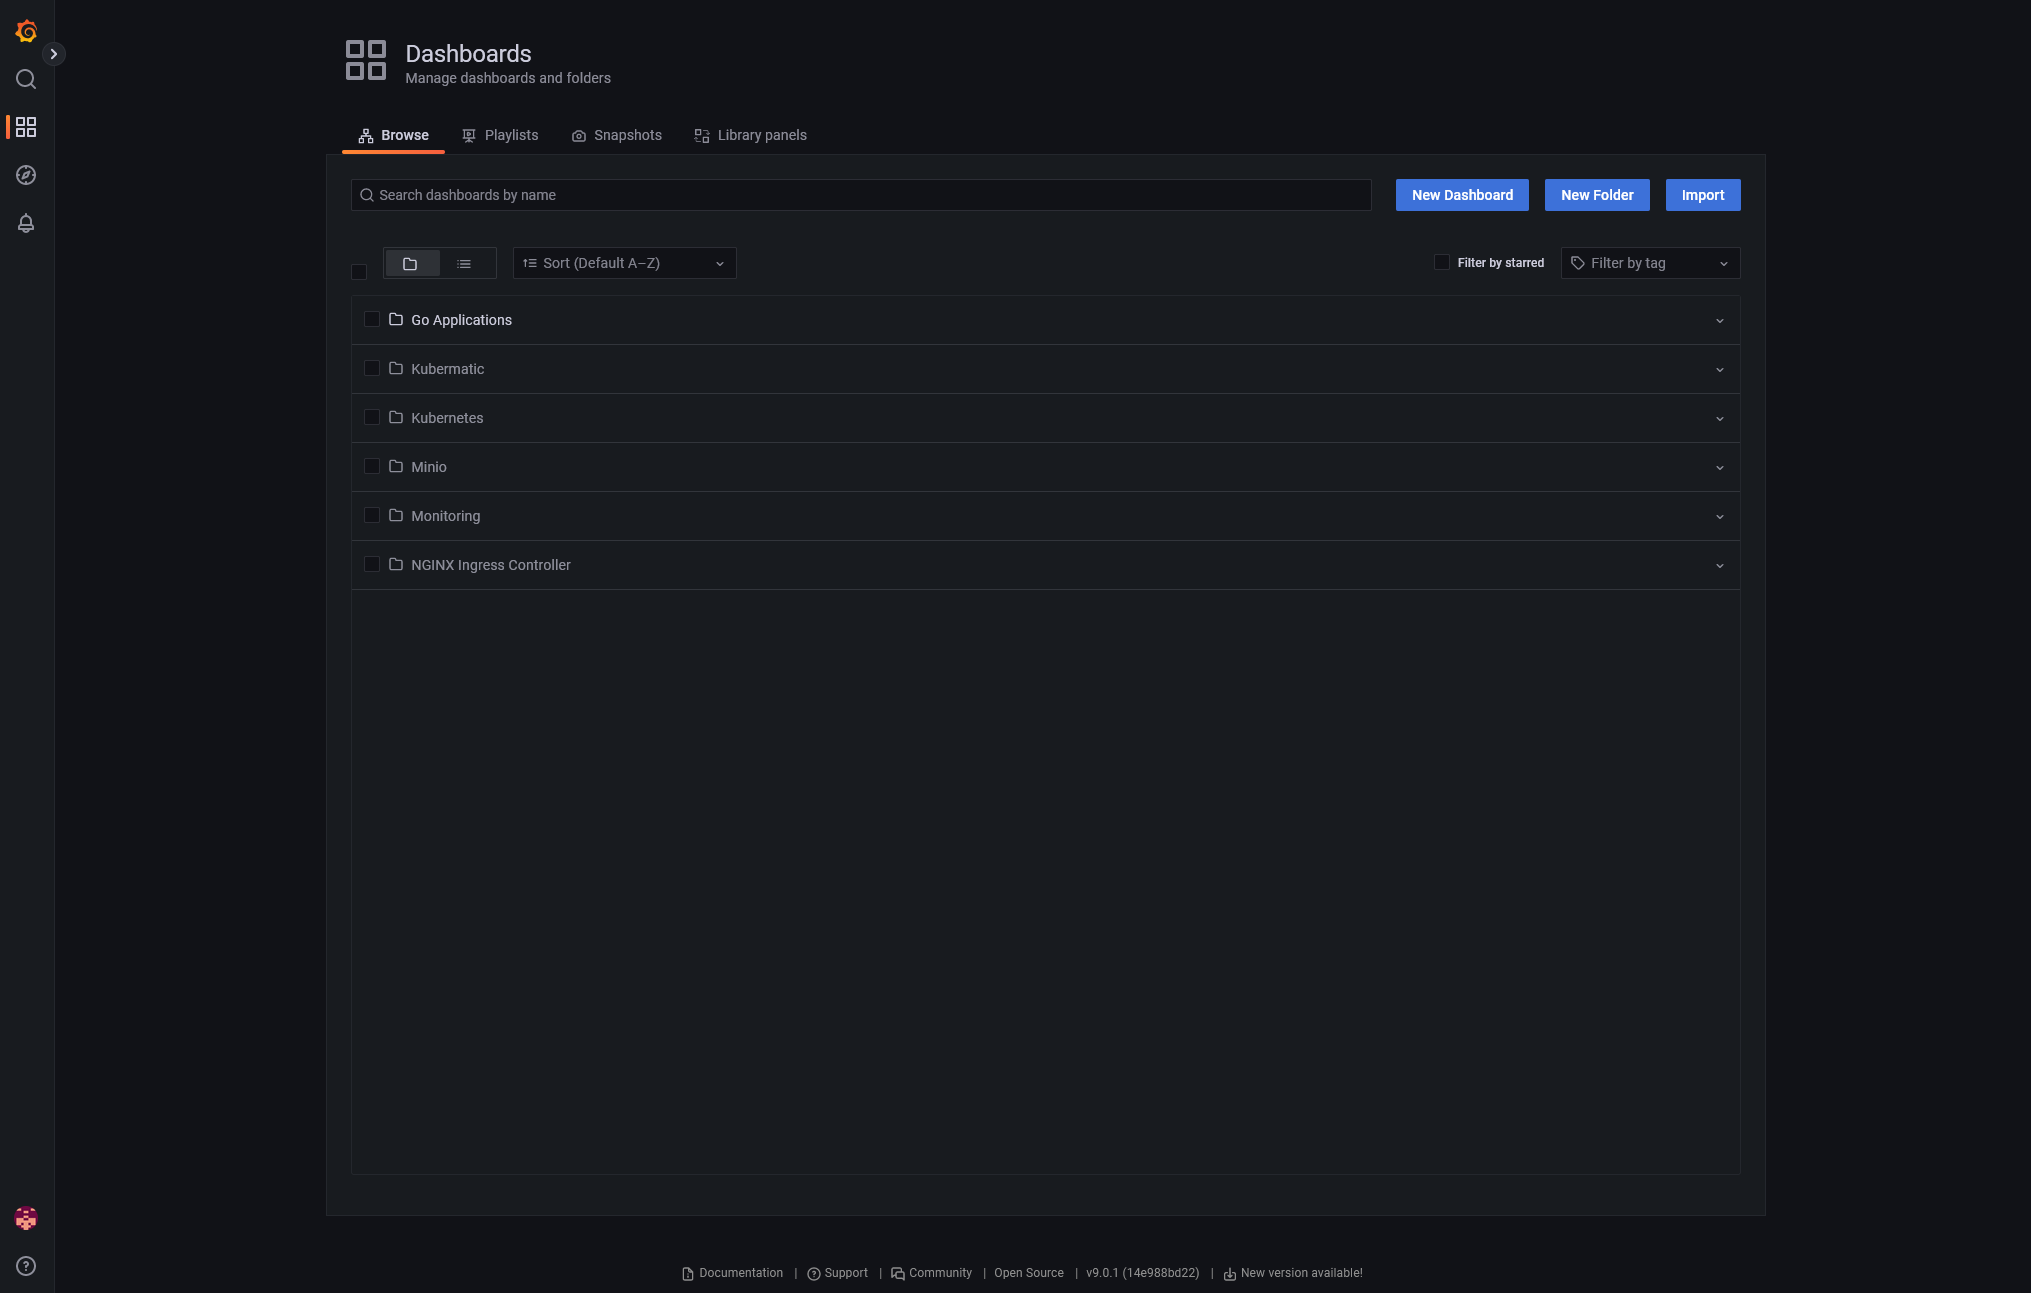
Dashboards list consists of categories as shown below, each containing Dashboards relevant to the specific area of KKP:
- Go Applications - Go metrics for applications running in the cluster.
- Kubermatic - dashboards provide insight into KKP components (described below).
- Kubernetes - dashboards used for monitoring Kubernetes resources of the seed cluster (described below).
- Minio - dashboards used for monitoring local MinIO installation.
- Monitoring - dashboards used for checking the health of the monitoring stack itself.
- NGINX Ingress Controller - dashboards used for visualising NGINX Ingress status.
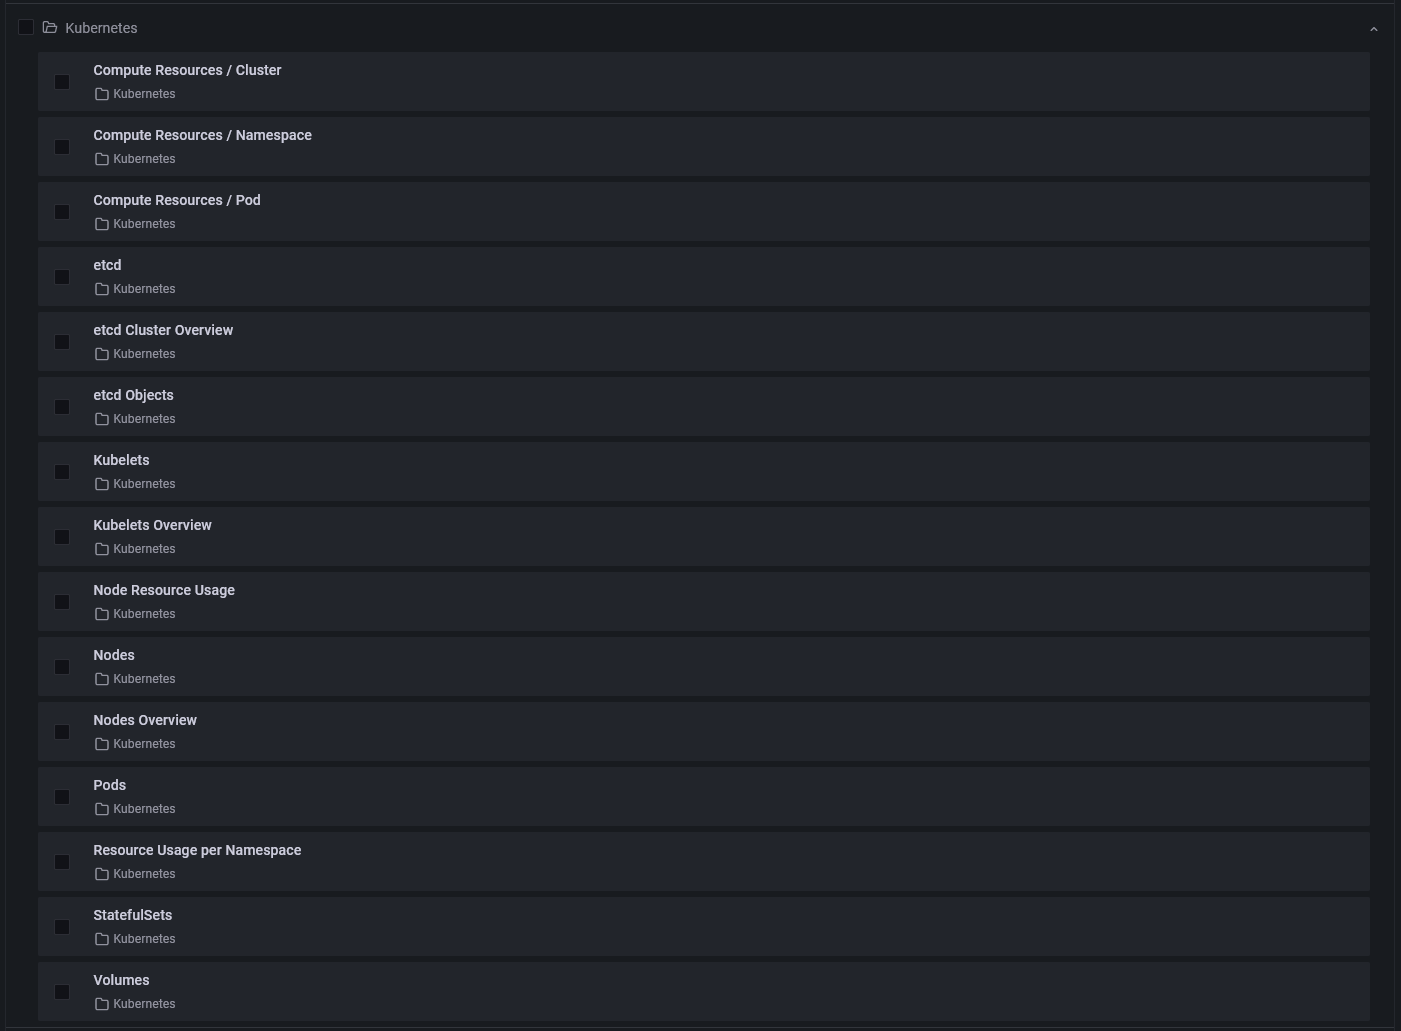
Monitoring Kubernetes
Dashboards contained in this section can be used to gain insight into state of KKP’s underlying Kubernetes cluster. The series of dashboards with names starting with “Compute Resources” allow analysing resources usage within the cluster with different levels of granularity (whole cluster, Namespaces, specific Pods).
Monitoring Kubermatic Kubernetes Platform
The dashboards contained in the Kubermatic section allow analysis of state and health of Kubermatic Kubernetes Platform and an easy overview of deployed User clusters.
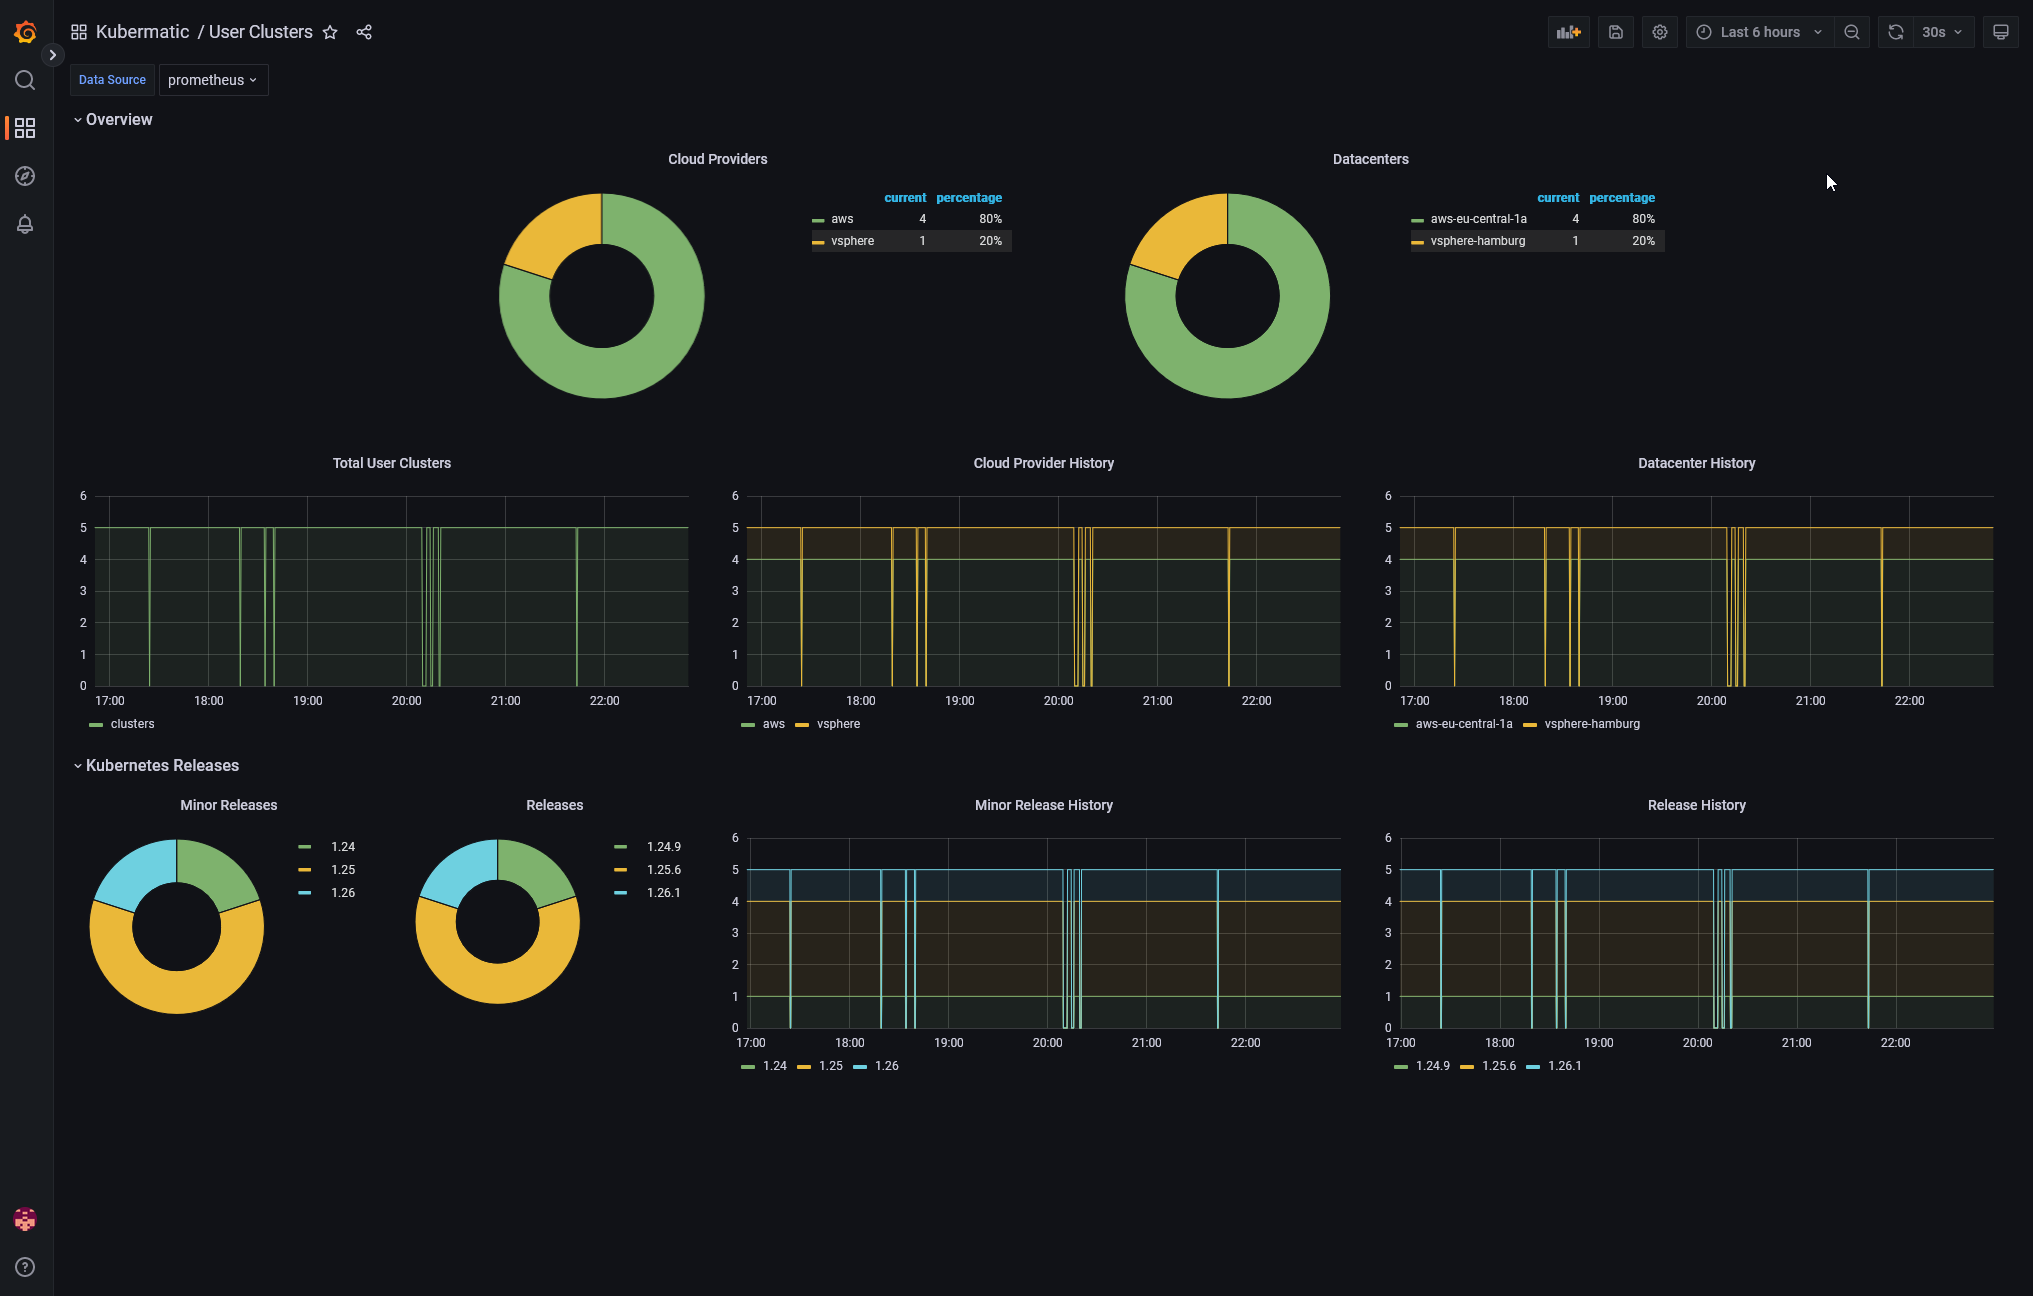
User Clusters Overview
This view contains statistics of cloud providers, datacenters and Kubernetes versions used across the deployed User Clusters.
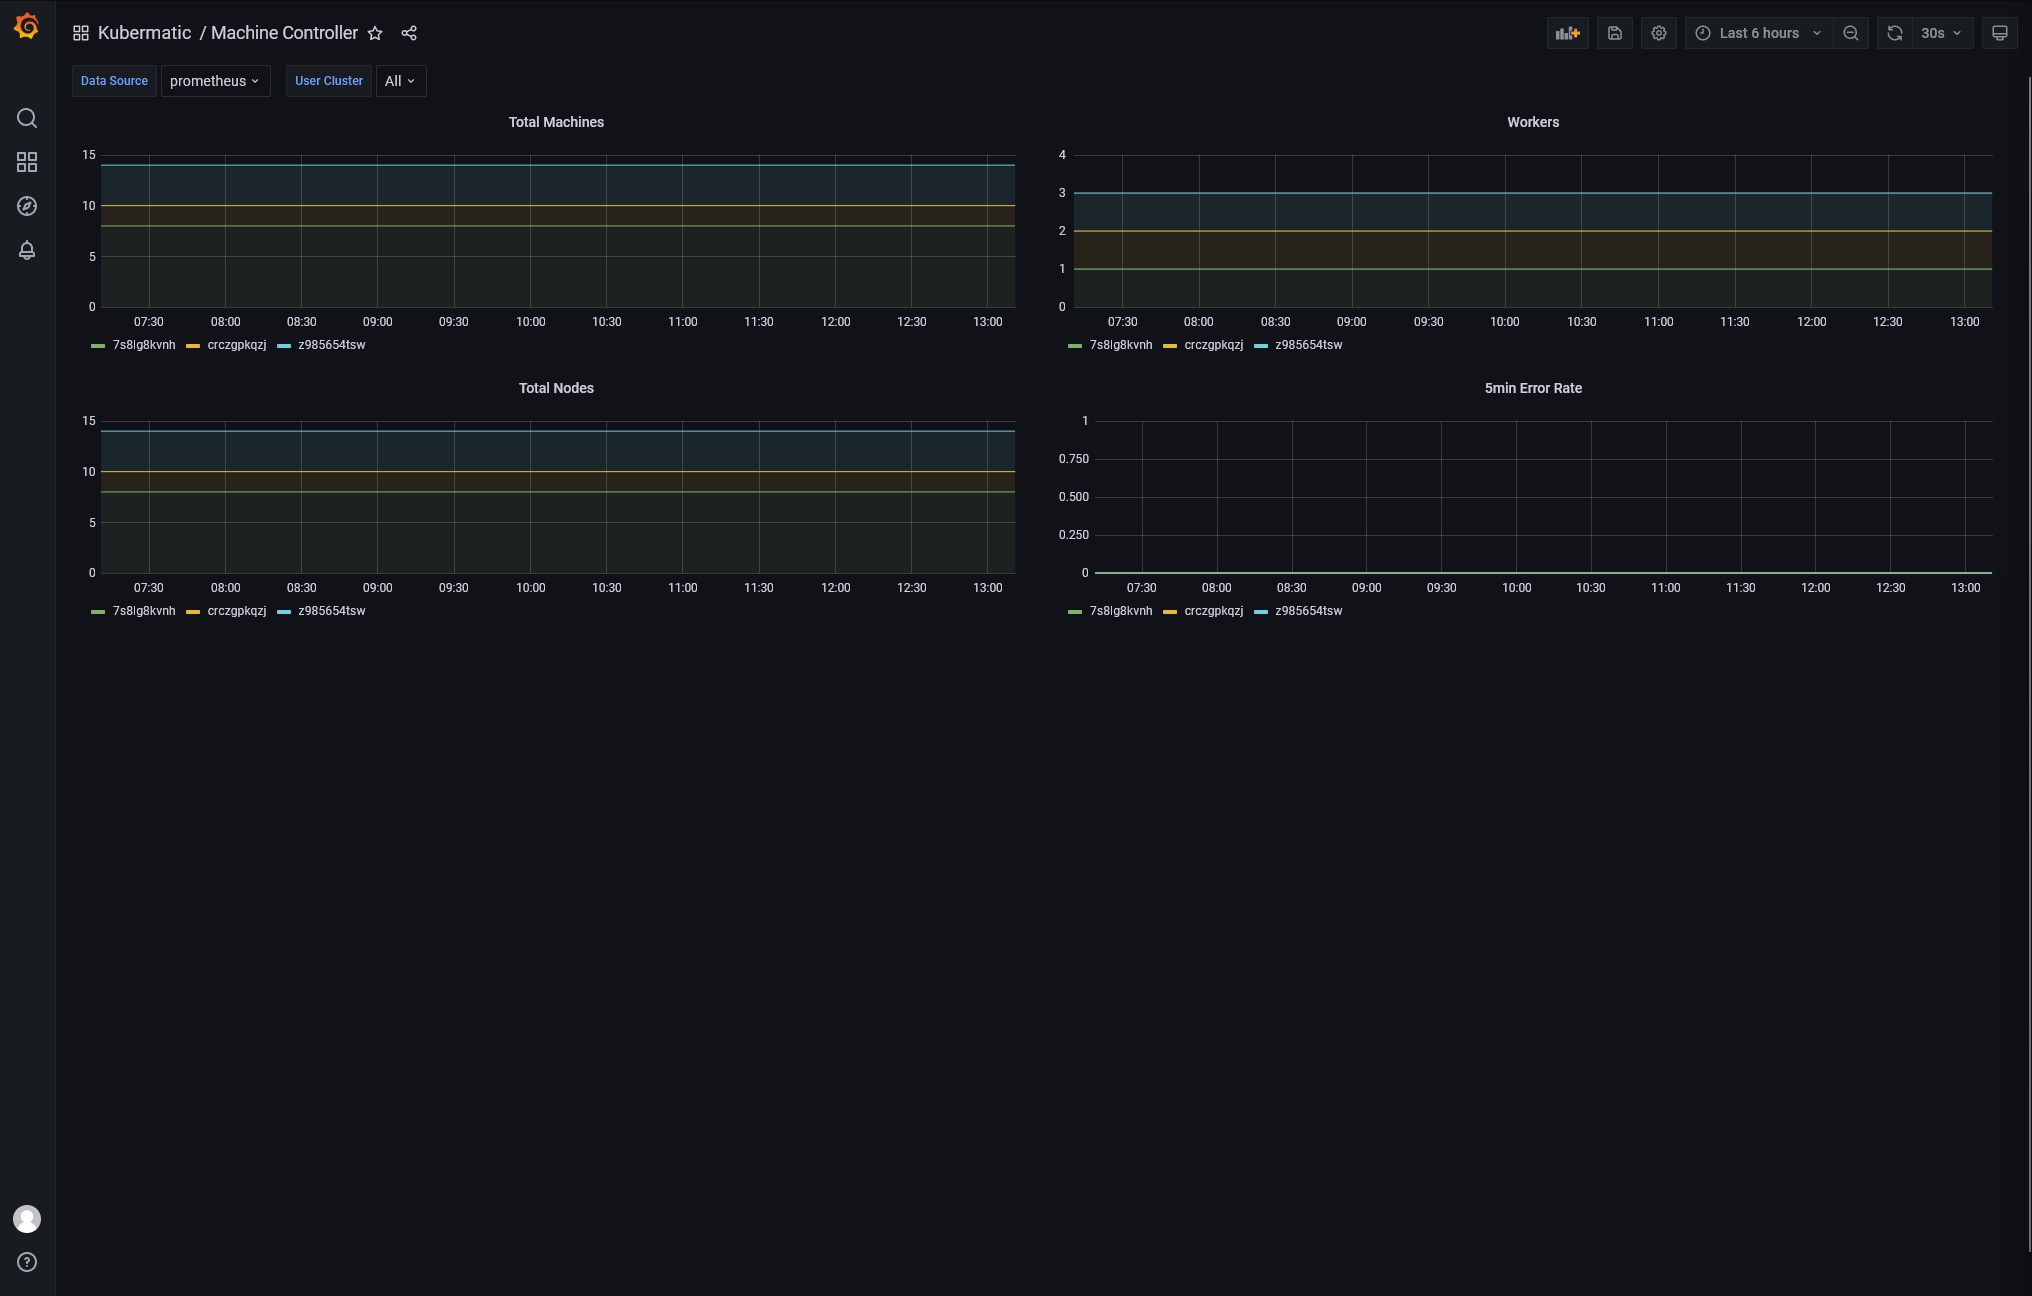
Machine Controller
This view contains information about Machine Controller’s state: number of deployed machines and their state over time. The dashboard can be used to analyse changes in the machines created by KKP.
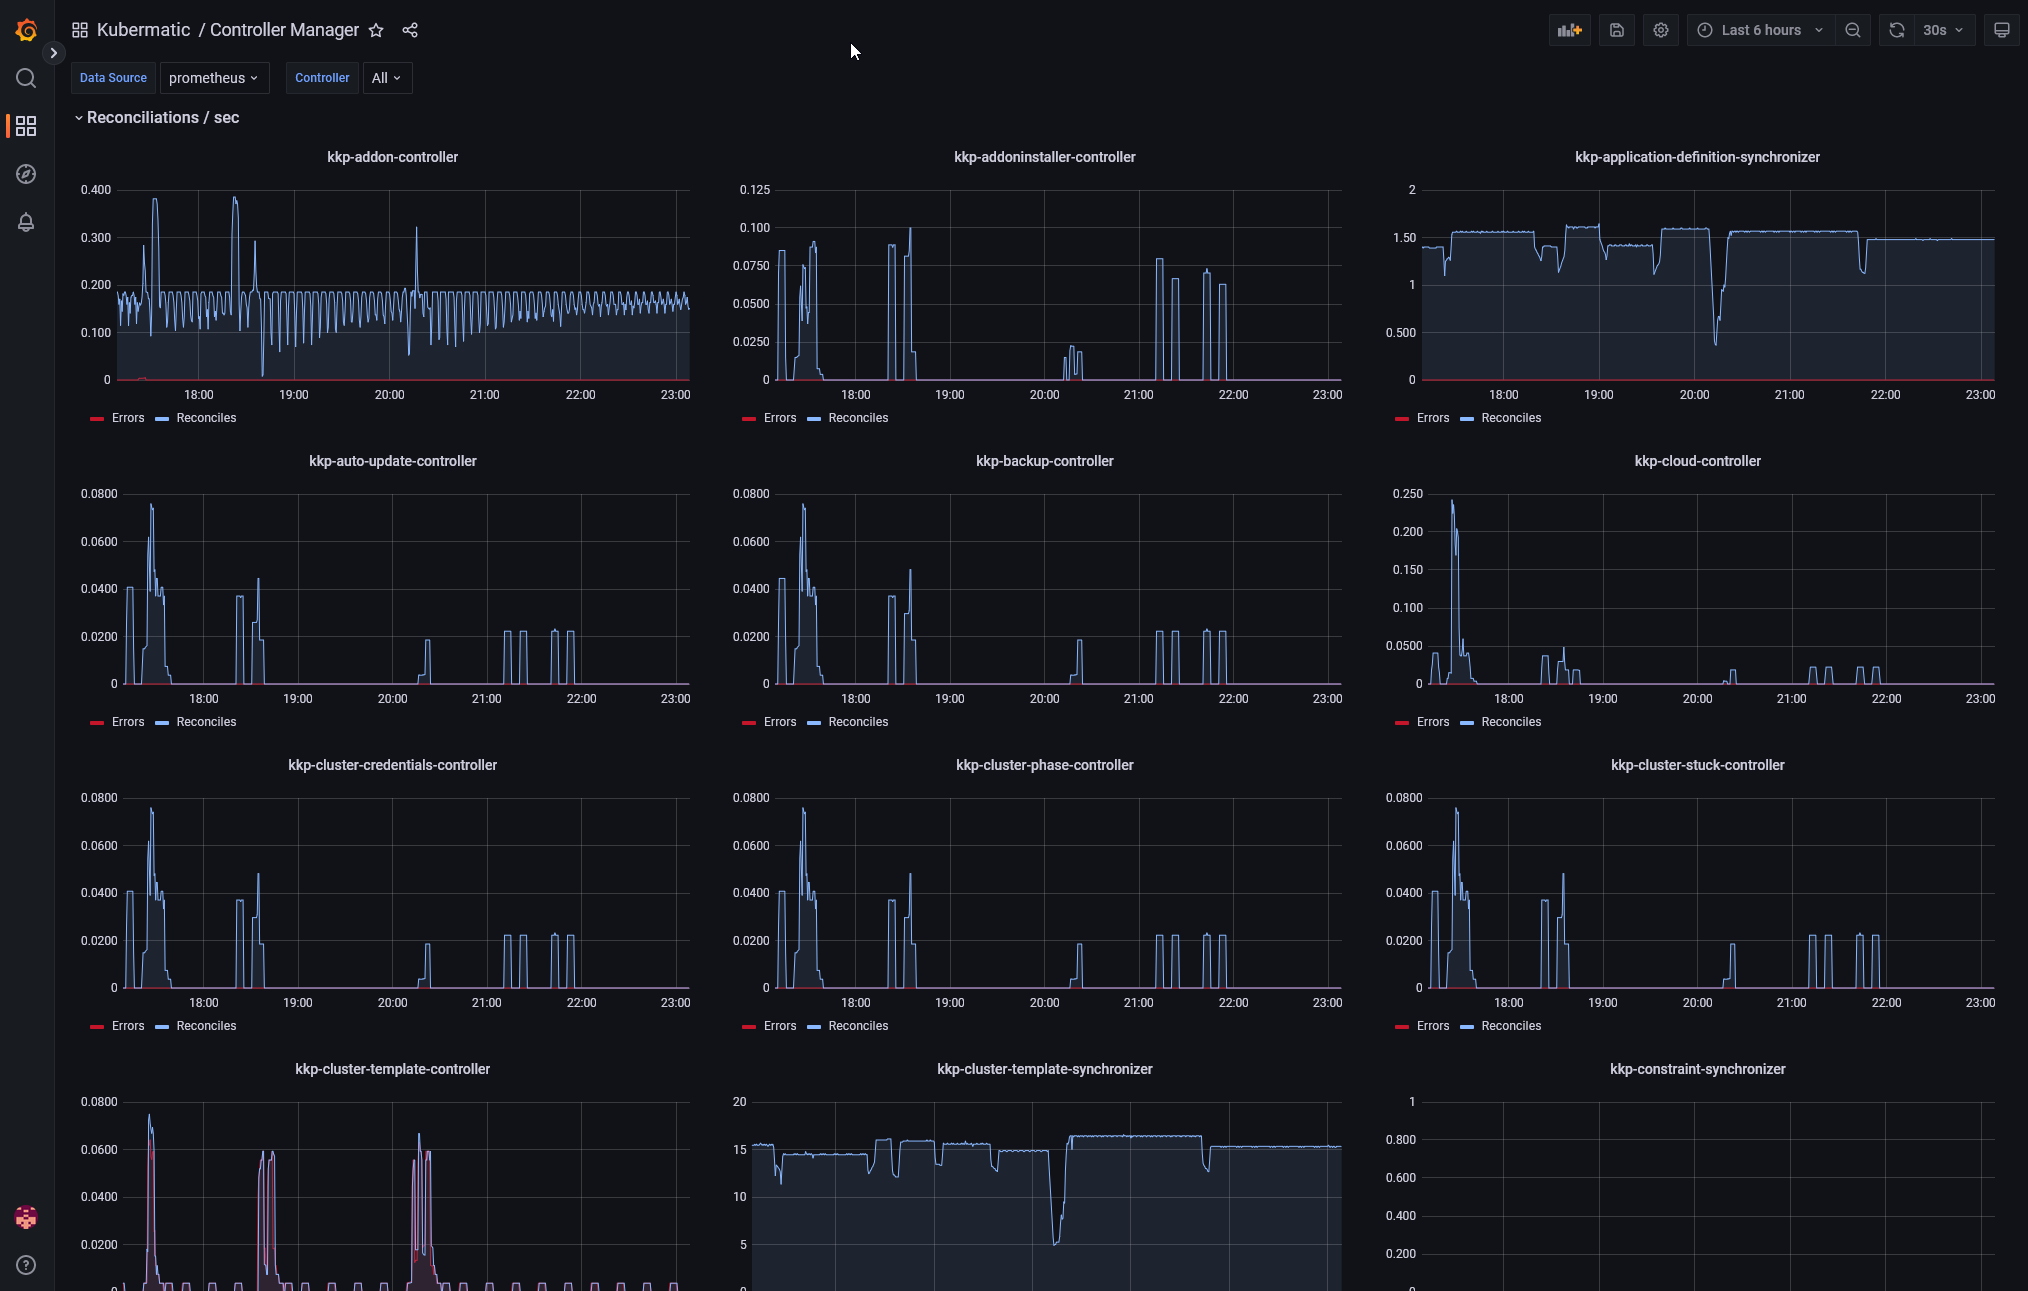
Controller Manager
This advanced view allows in-depth analysis of different controllers building Up the Kubermatic Kubernetes Platform. The following charts represent rates of successful and unsuccessful reconicliations of resources managed by KKP. This dashboard may be used for debugging and information derived from it can be requested by Kubermatic Support when solving a problem.