This chapter covers the monitoring and health assessments of User Clusters run using Kubermatic Kubernetes Platform.
Using KKP Dashboard for basic assessment
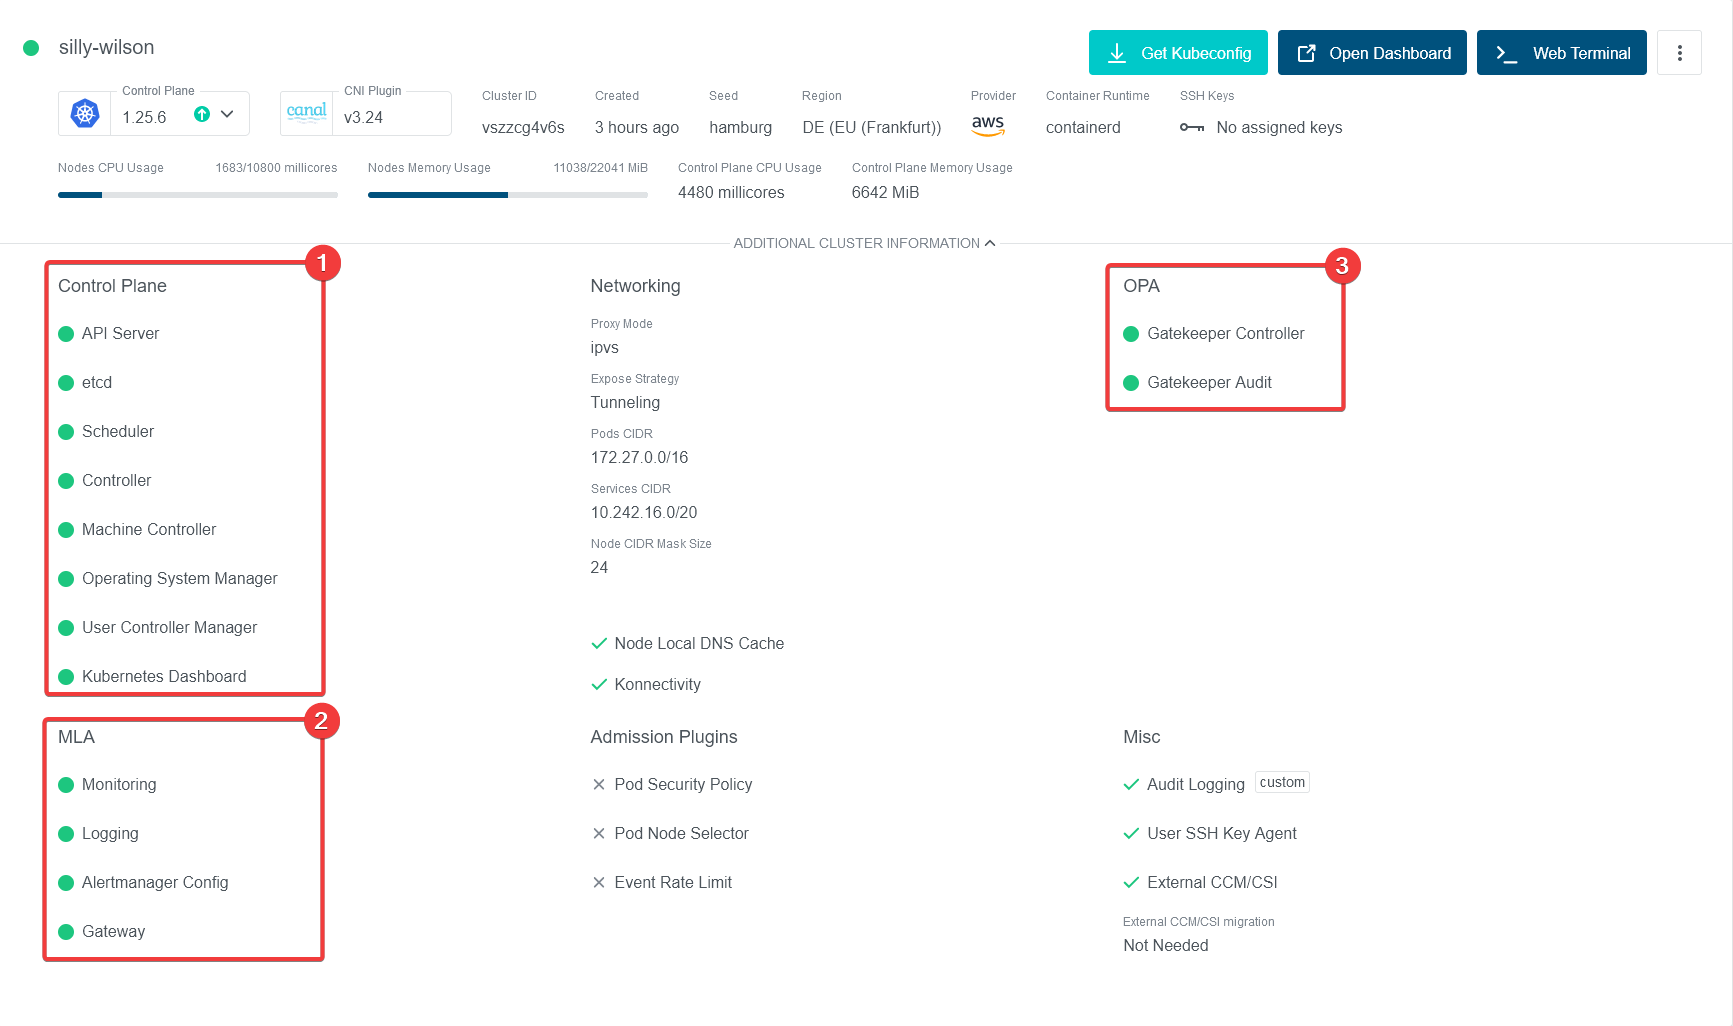
The User Cluster view in KKP Dashboard contains some basic information that can be used for assessment of that specific User Cluster’s health. As expected - green light means that the component is running properly, red emans that there’s an error. A loading spinner means that status is not yet retrieved or the component is being deployed.
The view can be split into several sections, as displayed in the picture below:
- Control Plane shows status of the Control Plane components running for the User Cluster.
- MLA shows the status of User Cluster Monitoring, Logging and Alerting components (if enabled).
- OPA shows Open Policy Agent status (if enabled).

Using Grafana
Grafana installation included in User Cluster MLA installation contains some basic dashboards. When you log in to the Grafana instance, you get access to the same list of projects that you have access to in KKP. To switch between the projects, click on your profile picture at the bottom-left corner of Grafana sidebar, then choose Switch organization and choose the project you want to browse.
In either of the dashboards shown in the section below, you can switch between different clusters created within the selected project (represented by the organization) by using the datasource dropdown in the dashboard.
MLA Dashboards
The dashboards provided within the User Cluster MLA Grafana allow for basic overview of the workloads running inside the User Clusters.

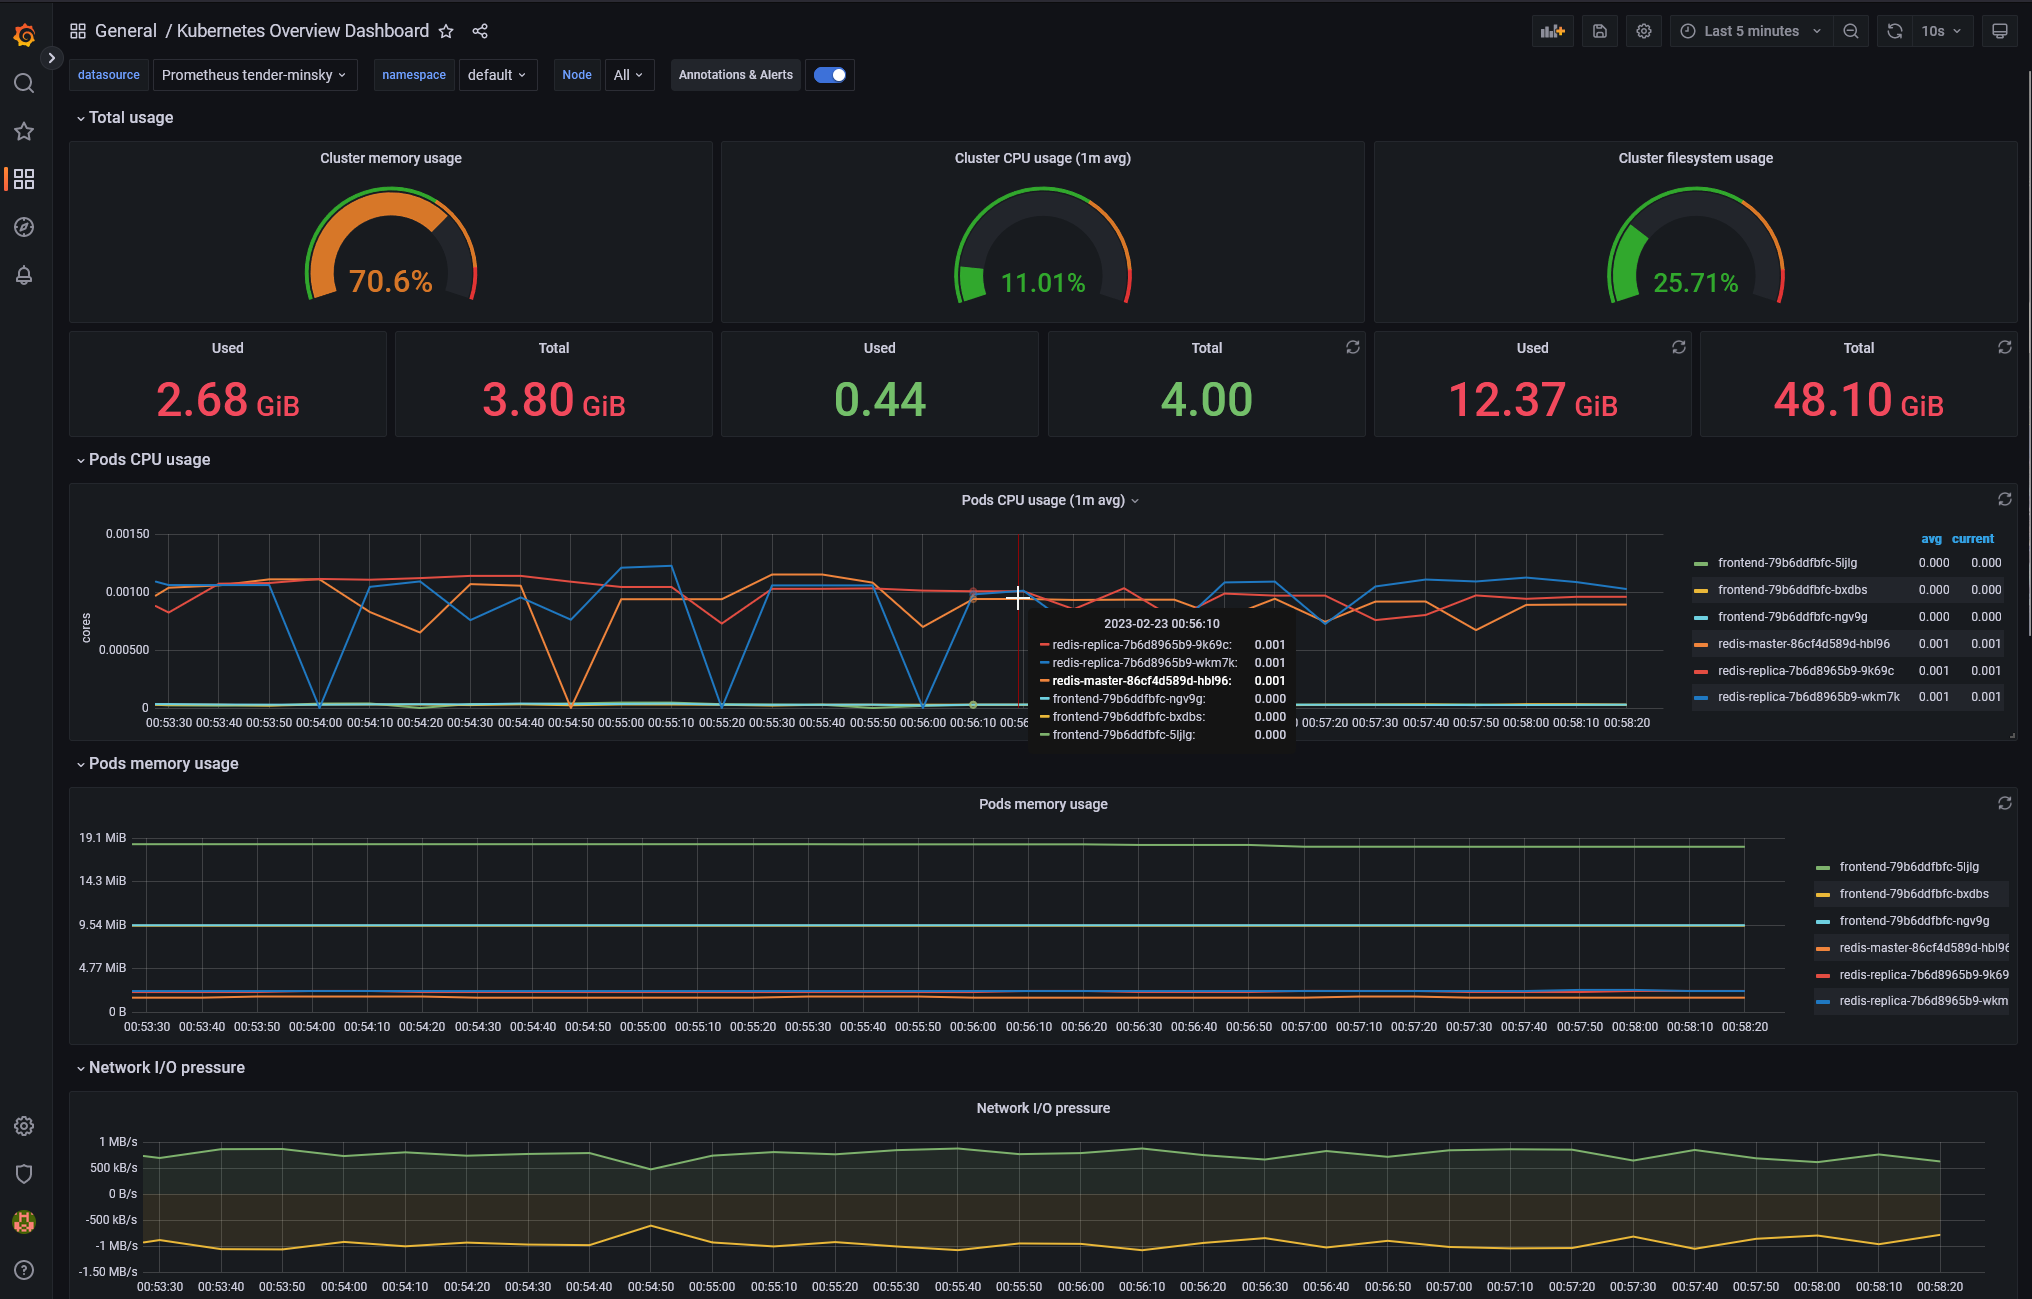
Kubernetes Overview Dashboard
The Kubernetes Overview Dashboard provides information about the workloads running on the User Cluster selected via the datasource dropdown. Charts contained here explicitly ignore the control plane pods and only cover actual workloads running inside the cluster.
