KKP Enterprise Edition (EE) offers optional measuring tools to achieve easier accountability of resources by providing weekly reports about per-cluster CPU and memory utilization. The tool will continuously collect information about all user clusters and create reports containing individual usage values. The configuration and report files can be easily accessed from the dashboard.
How it works
The metering tool will be deployed to each seed cluster by the operator.
From there it has access to the user clusters and requests their performance values every five minutes.
The collected information will be written to a CSV file, saved to a PersistentVolume and uploaded to your S3 bucket.
At the end of the weekly collection period, a CronJob will be triggered so that all data can be evaluated and written to a report file.
All files in the volume are mirrored to a S3 bucket, from where the reports can be accessed.
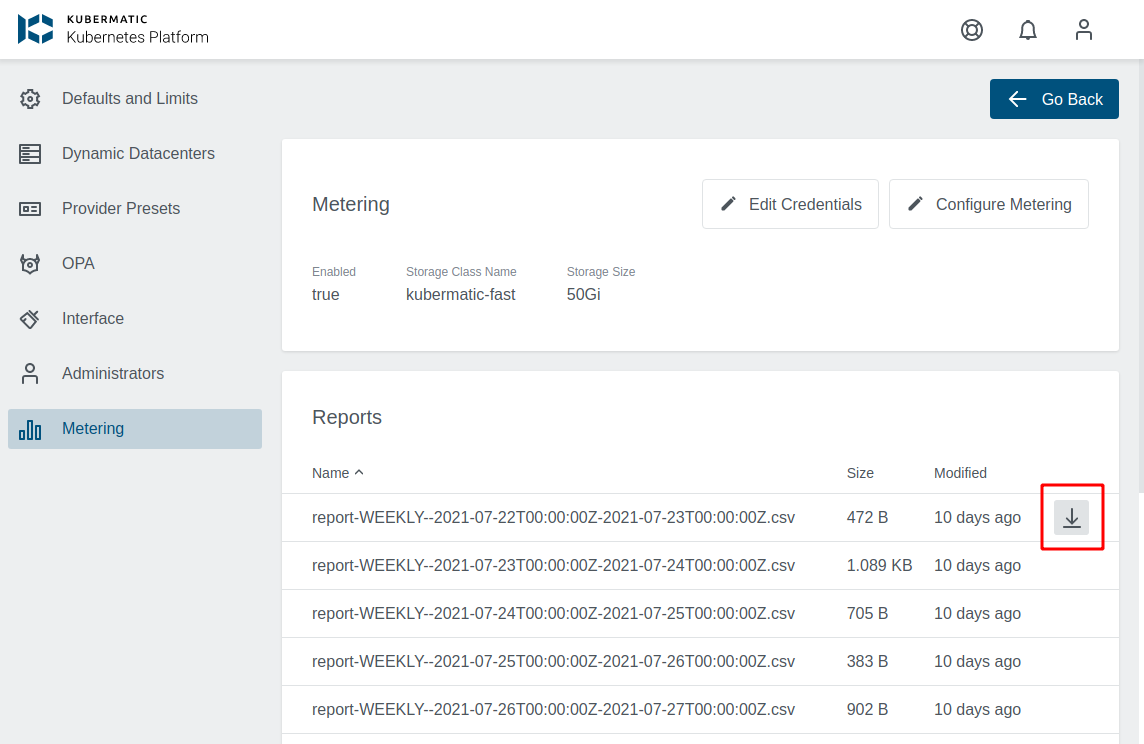
The dashboard provides a convenient way to list and download all available reports.
Configuration
Prerequisites
- S3 bucket
- Any S3-compatible endpoint can be used
- The bucket is required to store continuous usage data and final reports
- Administrator access to dashboard
- Administrator access can be gained by
- asking other administrators to follow the instructions for Adding administrators via the dashboard
- or by using kubectl to give a user admin access. Please refer to the Admin Panel documentation for instructions
- Administrator access can be gained by
Configuration from the Dashboard
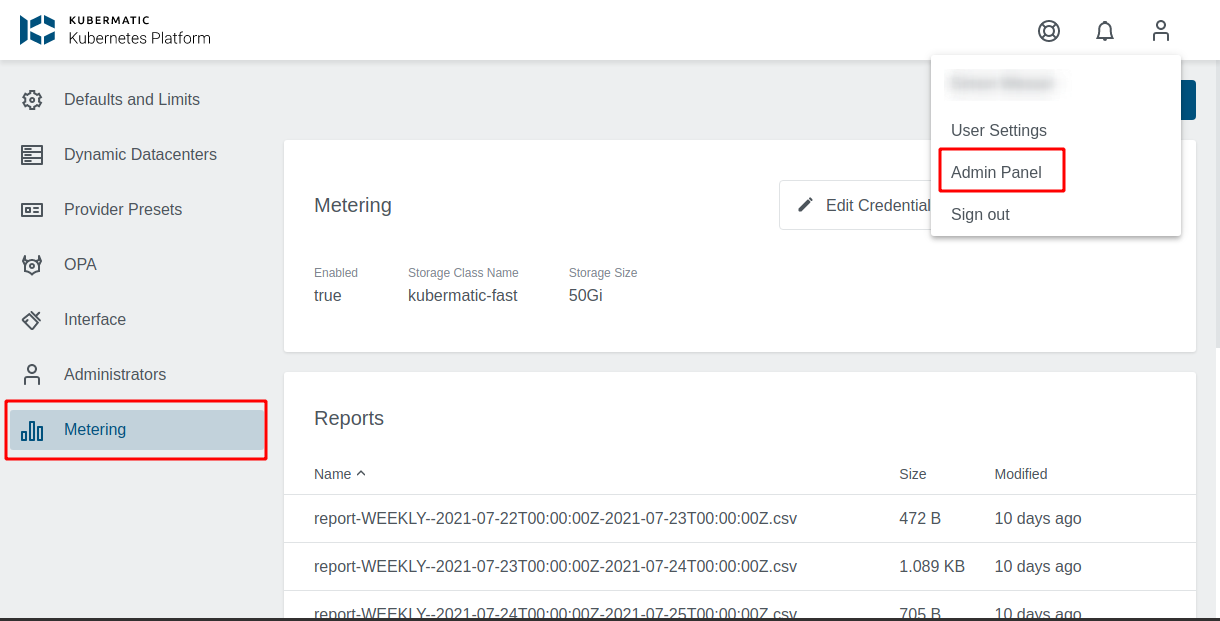
Using the dashboard, configuring the Metering tool becomes a breeze. Open the Admin Panel and choose the Metering tab on the left side.

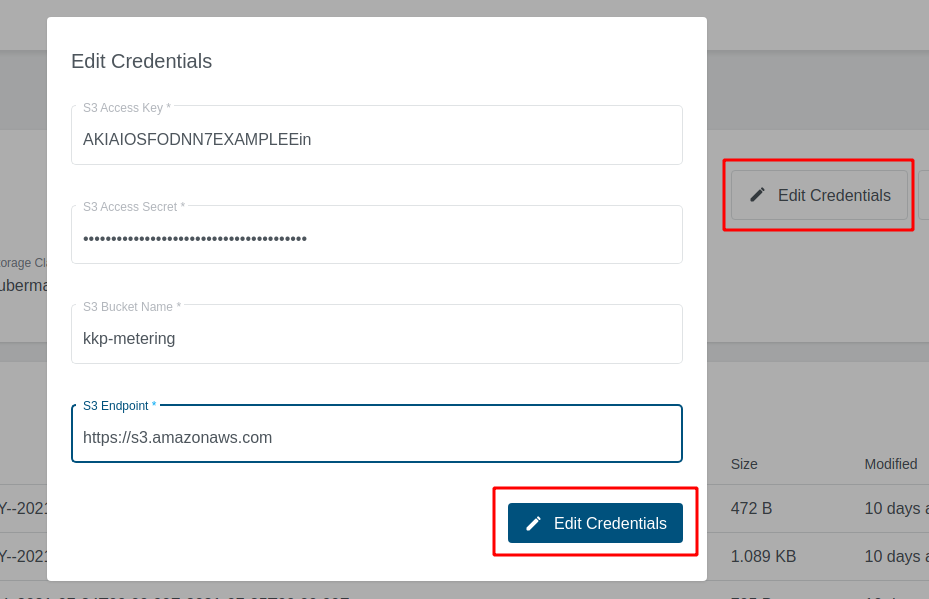
First you need to configure the credentials for your S3 bucket. To do so click on Edit credentials, fill in the credential fields and confirm with the button below.
- S3 Access Key and S3 Access Secret
- Security credentials for your S3 bucket
- S3 Endpoint
- Address to your S3 service
- If you are using Amazon S3, you may use
https://s3.amazonaws.com
- S3 bucket
- Name of your S3 bucket

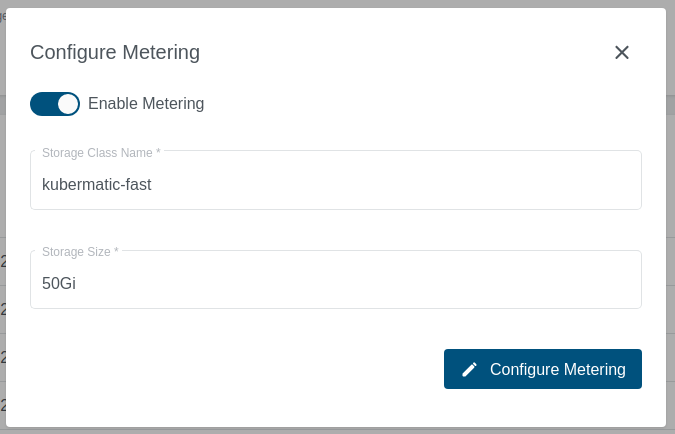
The next step is to enable metering. Click on Configure Metering, switch on Enable Metering and change the configuration options according to your wishes.
Enable metering- Switch to turn metering on or off
storageClassName- Storage Class for the PersistentVolume, that will store the metering data
- You may use
kubermatic-fastor any other storage class you have configured
storageSize- The size that will be used for your
PersistentVolume - You may use a plain integer value (bytes) or a human-readable string like
50Gi. See the Kubernetes Docs for a more thorough explanation of valid values - When choosing a volume size, please take into consideration that old usage data files will not be deleted automatically
- The size that will be used for your

Once the configuration values have been set and the metering has been enabled, the operator will take care of deploying the tool.
Reports
Reports will be provided as CSV files.
The file names include the reporting interval including the start and end timestamps, e.g. report-WEEKLY--2021-09-06T00:00:00Z-2021-09-13T00:00:00Z.csv.
Accessing Reports
While the reports will be stored in your S3-bucket, they can also be accessed from the dashboard. The metering overview provides a list of all reports. Click on the download button on the right side to save a specific report file.

Report Values
The following values will be written to the reports:
- Project ID
- Project labels
- Cluster ID
- Cluster labels
- Average available CPU
- Average used CPU
- Average available memory (bytes)
- Average used memory (bytes)
- Average number of used nodes
- First time seen (timestamp in RFC 3339 format)
- Last time seen (timestamp in RFC 3339 format)
- Cluster lifespan (seconds)
Please note that average values will be calculated over the whole reporting period (one week) and not over the cluster lifespan.
If one of your clusters ran one day and used a single CPU during that time, it will result in a value of 1/7 (approx 0.14) for the field Average used CPU.
Raw data
Raw data will be continuously written to CSV files with the name pattern metering--2021-01-01T00:00:00Z.csv.
The timestamp will be the creation date and the metering tool will start a new file at the end of your weekly collection period.
Do not delete these files during a collection period as they are providing the data for the final reports.
Raw data values
- Timestamp
- Seed cluster
- Project Id
- Project labels
- Cluster Id
- Cluster labels
- Worker name
- Worker labels
- Available CPU
- Used CPU
- Available memory (bytes)
- Used memory (bytes)
- SHA256 checksum
Checksums
The checksum of each record is calculated over the checksum of the previous record and the current record.