KKP Enterprise Edition (EE) offers optional measuring tools to achieve easier accountability of resources by providing reports about per-cluster or per-namespace CPU and memory utilization. The tool will continuously collect information about all user clusters and create reports containing individual usage values. Report creation can be scheduled individually on a daily basis. The configuration and report files can be easily accessed from the dashboard.
How it works
A metering Prometheus instance will be deployed to each seed cluster by the KKP operator. This will collect usage information from the user cluster Prometheus instance via federation. The collected information will be saved in the metering Prometheus for 90 days.
When a scheduled report is executed, data in the metering Prometheus gets aggregated to create a report from. Generated reports are uploaded to an S3 bucket, from where the reports can be accessed. The KKP dashboard provides a convenient way to list and download all available reports. For that to work properly the s3 endpoint needs to be available from the browser.
Configuration
Prerequisites
- S3 bucket
- Any S3-compatible endpoint can be used
- The bucket is required to store report csv files
- Should be available via browser
- Administrator access to dashboard
- Administrator access can be gained by
- asking other administrators to follow the instructions for Adding administrators via the dashboard
- or by using
kubectlto give a user admin access. Please refer to the Admin Panel documentation for instructions
- Administrator access can be gained by
Configuration from the Dashboard
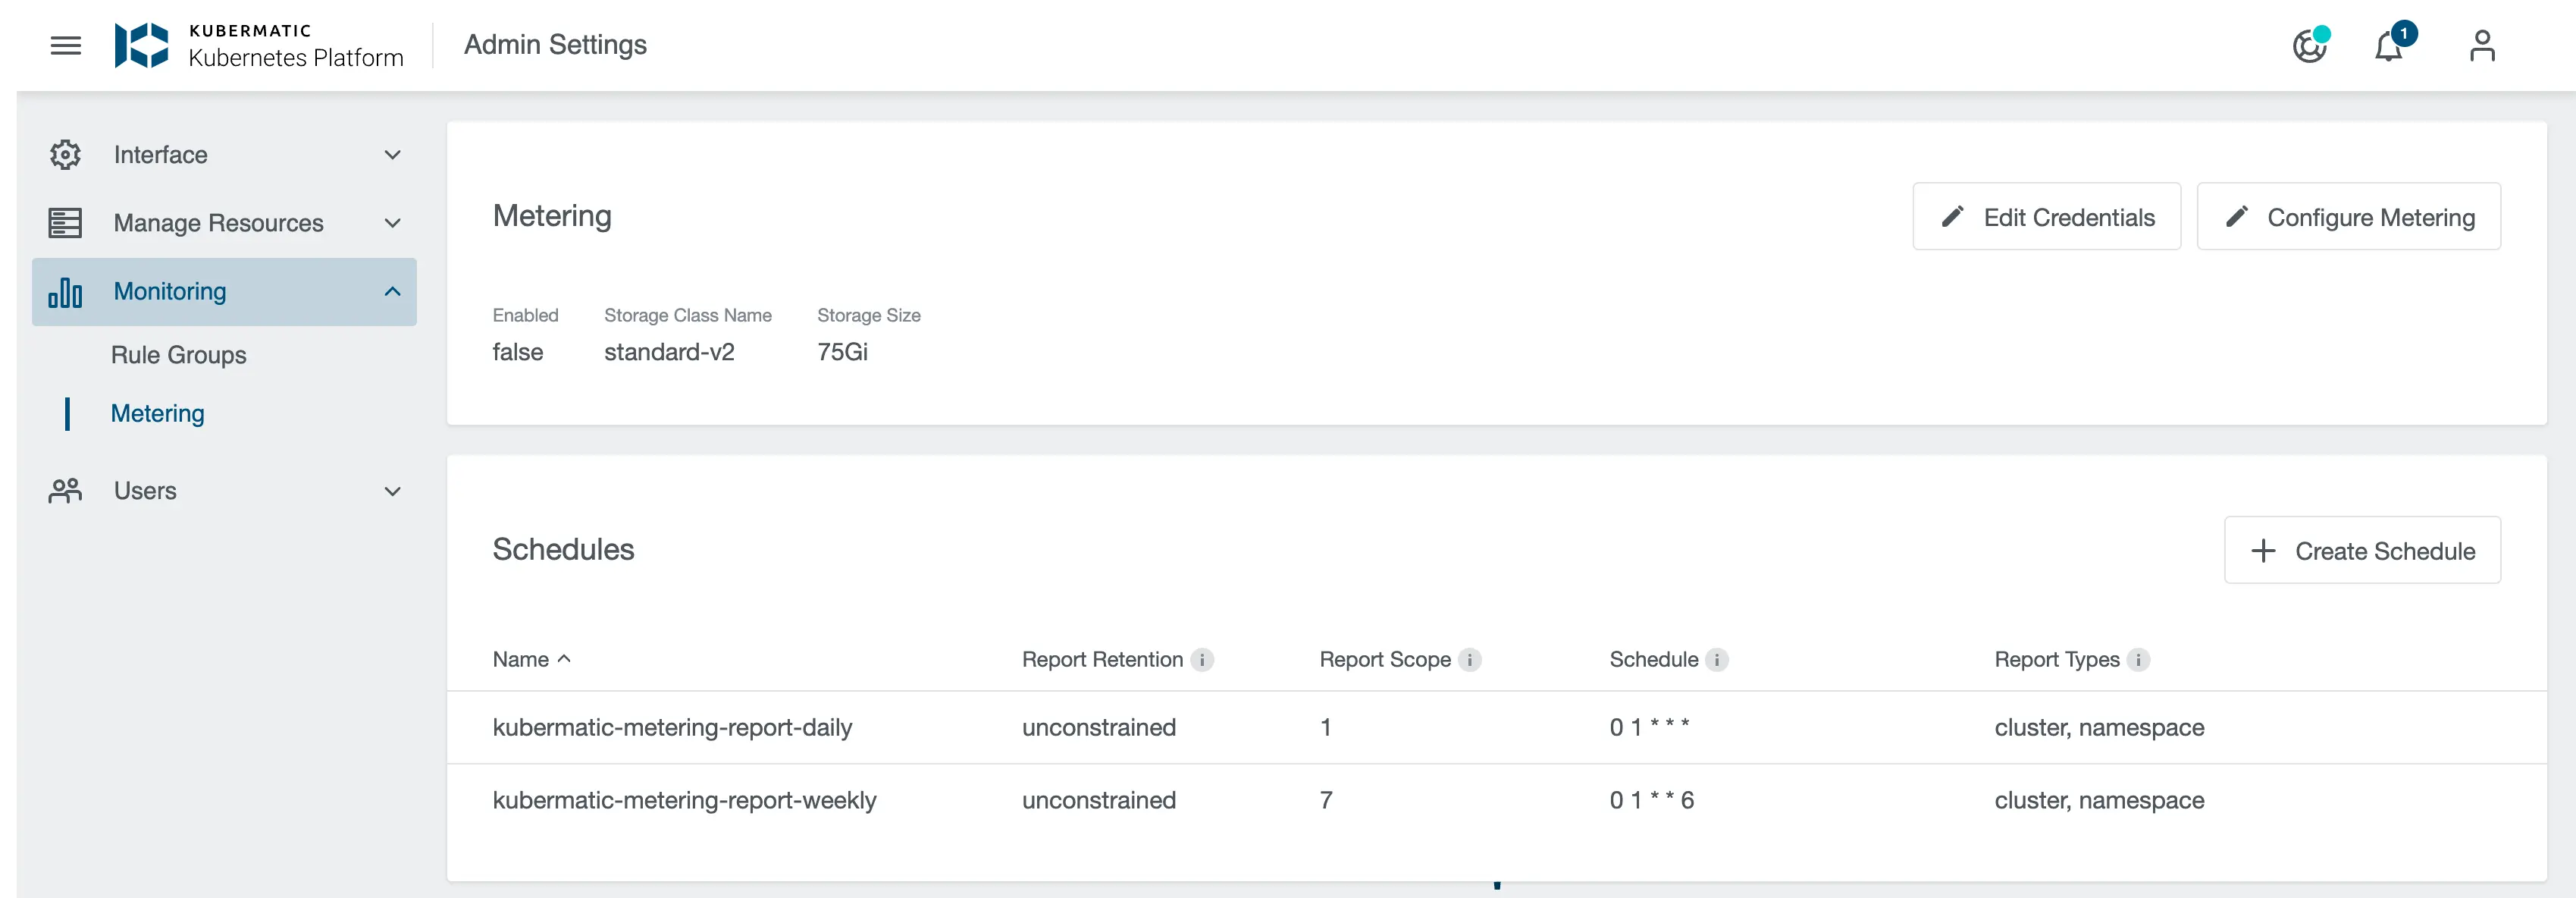
Using the dashboard, configuring the Metering tool becomes a breeze. Open the Admin Panel and choose the Metering tab on the left side.

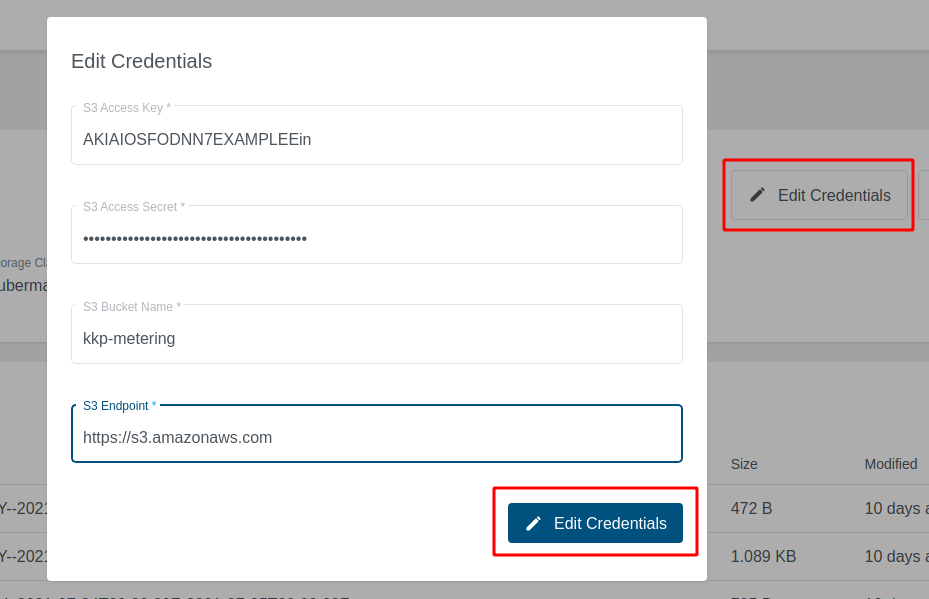
First you need to configure the credentials for your S3 bucket. To do so click on Edit credentials, fill in the credential fields and confirm with the button below.
- S3 Access Key and S3 Access Secret
- Security credentials for your S3 bucket
- S3 Endpoint
- Address to your S3 service
- If you are using Amazon S3, you may use
https://s3.amazonaws.com
- S3 bucket
- Name of your S3 bucket

The next step is to enable metering. Click on Configure Metering, switch on Enable Metering and change the configuration options according to your wishes.
Enable metering- Switch to turn metering on or off
storageClassName- Storage Class for the PersistentVolume, that will store the metering data
- You may use
kubermatic-fastor any other storage class you have configured
storageSize- The size that will be used for your
PersistentVolume - You may use a plain integer value (bytes) or a human-readable string like
50Gi. See the Kubernetes Docs for a more thorough explanation of valid values - When choosing a volume size, please take into consideration that old usage data files will not be deleted automatically
- The size that will be used for your
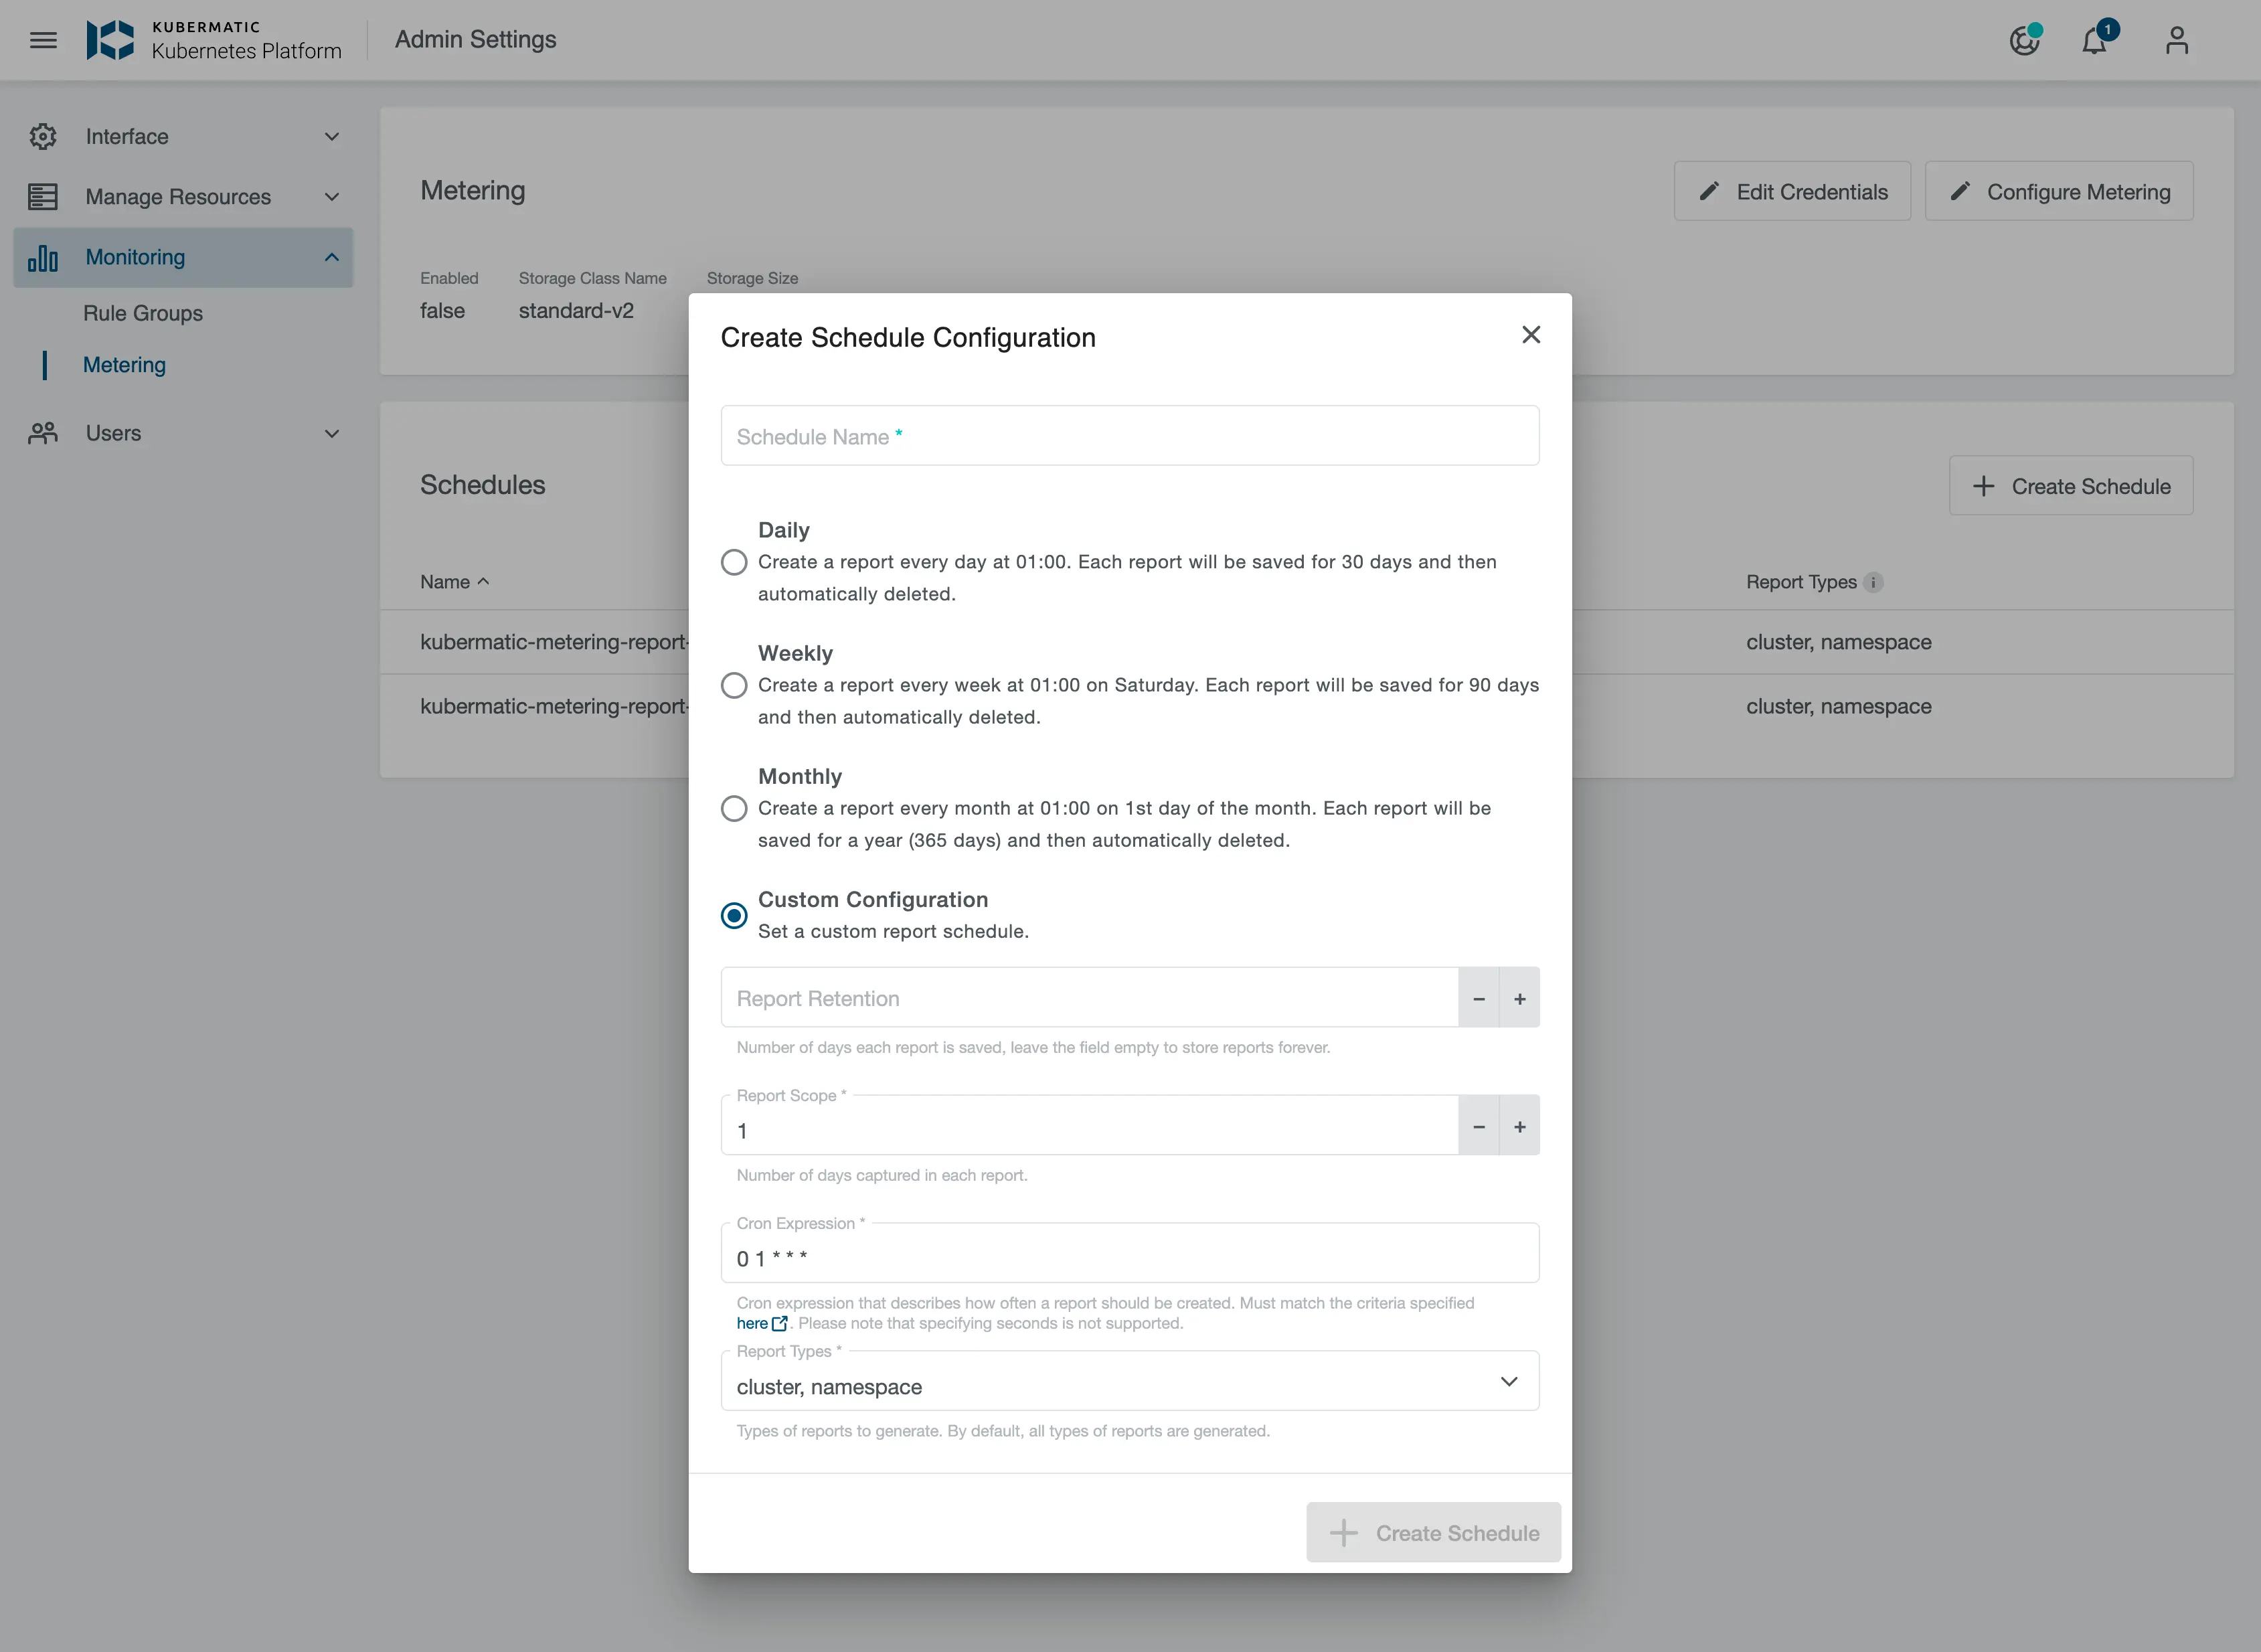
In the end it is possible to create different report schedules. Click on Create Schedule, to open the Schedule configuration dialog.
Below to the three predefined Schedules it is possible to create a custom schedule. A schedule consist of four different values to set:
Schedule Name- Name of the Schedule. This is also used as a folder name to store generated reports.
Report retention- Number of days each report is saved, leave the field empty to store reports forever. This will set a retention period at the s3 Backend.
Report scope- Number of days captured in each report.
Cron Expression- Cron expression that describes how often a report should be created.
Report Types- Types of reports to generate. By default, all types of reports are generated.

Configuration via Seed Object
It is possible to set Metering values directly at the Seed. This allows enabling Metering only for specific Seeds.
For S3 report synchronization, it is mandatory to create a secret with the following values:
apiVersion: v1
kind: Secret
metadata:
 name: metering-s3
 namespace: kubermatic
data:
 accessKey: ""
 bucket: ""
 endpoint: ""
 secretKey: ""
Metering Seed configuration reference:
apiVersion: kubermatic.k8c.io/v1
kind: Seed
spec:
  metering:
    enabled: true
    # StorageClassName is the name of the storage class that the metering prometheus instance uses to store metric data for reporting.
    storageClassName: ""
    # StorageSize is the size of the storage class. Default value is 100Gi.
    storageSize: 100Gi
    reports:
      weekly:
        interval: 7
        schedule: 0 1 * * 6
        # Types of reports to generate. Available report types are cluster and namespace. By default, all types of reports are generated.
        type:
          - Cluster
          - Namespace
Reports
Reports will be provided as CSV files. The file names include the reporting interval.
Data used to aggregate the report are stored in a prometheus instance dedicated to metering. It will delete entries older than 90 days. This metering prometheus instance collects data from user clusters via federation. Originally they are collected from kubelet and cAdvisor. Metrics used to aggregate to a report are as follows:
node_cpu_usage_seconds_totalmachine_cpu_coresmachine_cpu_coresmachine_memory_bytesmachine_memory_bytesnode_memory_working_set_bytesnode_memory_working_set_bytescontainer_cpu_usage_seconds_totalcontainer_memory_working_set_bytes
Metrics are used to calculate an average value for the time period of the report.
CPU values are converted to milliCPU, memory values are converted to bytes.
Accessing Reports
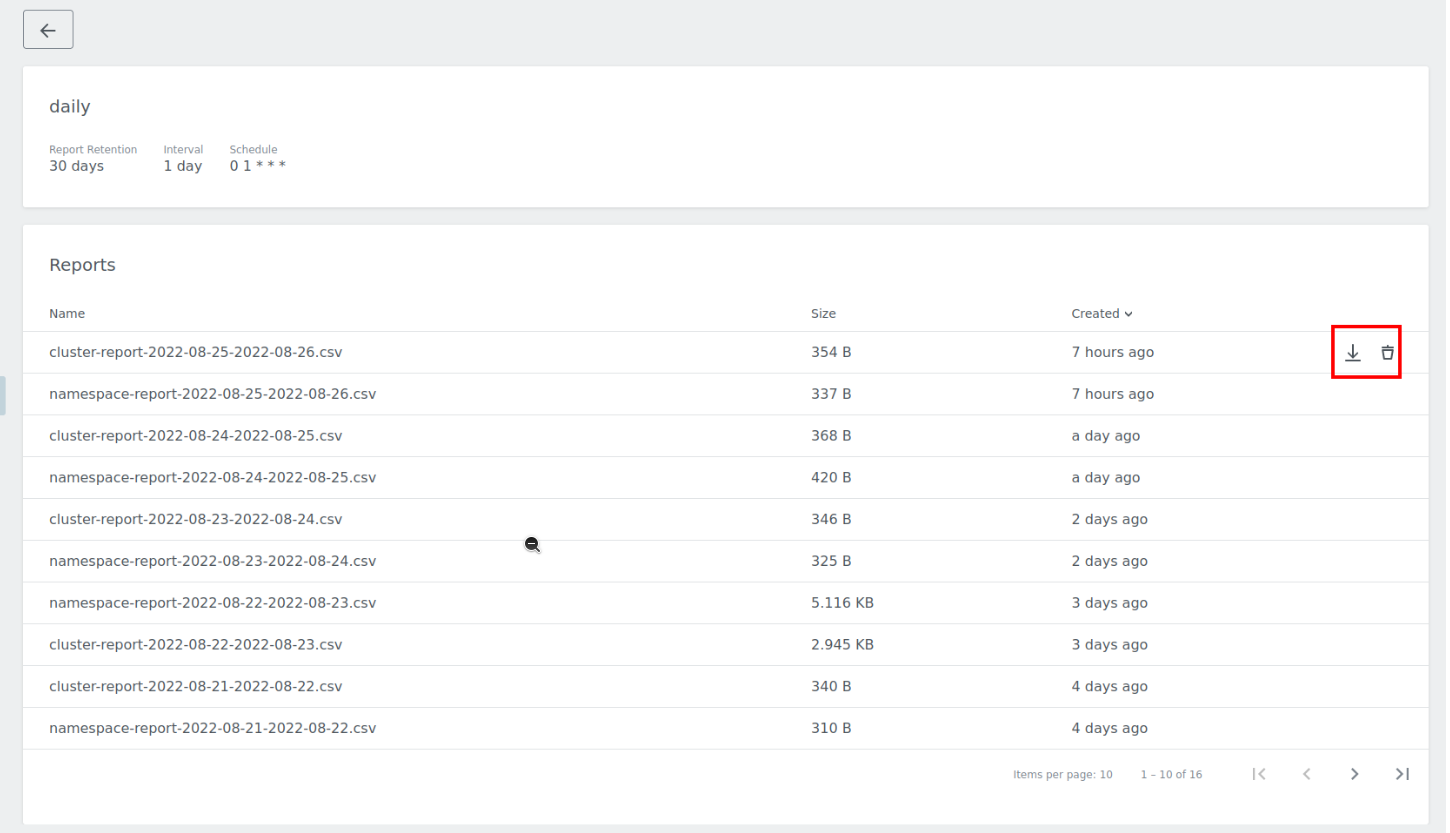
While the reports will be stored in your S3 bucket, they can also be accessed from the dashboard. The metering overview provides a list of all reports. Click on the download button on the right side to save a specific report file.

Cluster Report
The cluster report consist information on a per-cluster level. The report file will contain the following columns:
project-name– the human readable name of the projectproject-id– the KKP project the cluster resides in (this field is the name of theProjectobject, in KKP colloquially known as the “project ID”, not to be confused with a Kubernetes UID; when using the KKP Dashboard only, this always has the form of a 10 character long alphanumeric string, e.g.vnk4846f76)project-labels– a string containing theProjectobject’s labels in form of a Kubernetes label selector (e.g.foo=bar,another=label)cluster-name– the human readable name of the clustercluster-id– the KKP cluster ID (same logic as for projects; this is the name of the KubernetesClusterobject; when using the KKP Dashboard only, this always has the form of a 10 character long alphanumeric string, e.g.ipcl4wr297)cluster-labels– likeproject-labels, but the labels of theClusterobjectaverage-cluster-machines– the average number of Nodes in the user cluster over the entire report durationaverage-available-cpu-millicores– the average of the sum of CPU MilliCores provided by all nodes in the user clusteraverage-used-cpu-millicores– the average of the sum of CPU MilliCores used by all Pods in the user clusteraverage-available-memory-bytes– the average of the sum of memory provided by all nodes in the user clusteraverage-used-memory-bytes– the average of the sum of memory used by all Pods in the user clustercreated-at– RFC3339-formatted timestamp at which the cluster was createddeleted-at– RFC3339-formatted timestamp at which the cluster was deleted (can be empty)
Namespace Report
This report consist information on a per namespace level. The report file will contain the following columns:
project-name– the human readable name of the projectproject-id– the KKP project the cluster resides in (this field is the name of theProjectobject, in KKP colloquially known as the “project ID”, not to be confused with a Kubernetes UID)project-labels– a string containing theProjectobject’s labels in form of a Kubernetes label selector (e.g.foo=bar,another=label)cluster-name– the human readable name of the clustercluster-id– the KKP cluster ID (same logic as for projects; this is the name of the KubernetesClusterobject)cluster-labels– likeproject-labels, but the labels of theClusterobjectnamespace-name– the name of the namespaceaverage-used-cpu-millicores– the average of the sum of CPU MilliCores used by all Pods in the given namespaceaverage-used-memory-bytes– the average of the sum of memory used by all Pods in the given namespace
Custom Reports
Reports can be manually created when necessary. This can be the case if the automated CronJob failed, the cluster was unavailable at the time or a different report time range is desired.
To create a custom report once, create a Job object in the kubermatic namespace on the relevant
seed cluster. While report generation normally uses flags like -last-week or -number-of-days, for
a custom report you will probably want to make use of the -start and -end flags, which allow you
to specify the exact date range for your report.
This is an example Job that would create a specific report:
apiVersion: batch/v1
kind: Job
metadata:
  name: generate-my-custom-report
  namespace: kubermatic
spec:
  template:
    metadata:
      labels:
        report-name: my-custom-report
    spec:
      restartPolicy: OnFailure
      containers:
        - name: metering
          # verify in your KKP setup which metering version ships with your KKP, e.g. by looking
          # at the other CronJobs managed by the KKP Dashboard:
          #
          #   kubectl --namespace kubermatic get cronjobs --selector "app.kubernetes.io/component=metering" -o yaml | grep image
          image: quay.io/kubermatic/metering:___
          args:
            - --ca-bundle=/opt/ca-bundle/ca-bundle.pem
            - --prometheus-api=http://metering-prometheus.kubermatic.svc
            # specify a unique name in order not to interfere with the regular scheduled reports
            - --output-dir=kubermatic-my-custom-report
            # specify the prefix name, which is usually the name of the seed cluster
            - --output-prefix=<<SEED_NAME>>
            # specify the output format (csv or json)
            - --output-format=csv
            # specify the date range for your report; --start is the older of the two timestamps.
            # Example: --start=2023-04-01T00:00:00Z --end=2023-05-01T00:00:00Z
            # Note: you must specify the date including time and timezone in RFC3339 format.
            - --start=<RFC3339-formatted date>
            - --end=<RFC3339-formatted date>
            # specify the report(s) you want generated
            - cluster
            - namespace
          env:
            - name: S3_ENDPOINT
              valueFrom:
                secretKeyRef:
                  key: endpoint
                  name: metering-s3
            - name: S3_BUCKET
              valueFrom:
                secretKeyRef:
                  key: bucket
                  name: metering-s3
            - name: ACCESS_KEY_ID
              valueFrom:
                secretKeyRef:
                  key: accessKey
                  name: metering-s3
            - name: SECRET_ACCESS_KEY
              valueFrom:
                secretKeyRef:
                  key: secretKey
                  name: metering-s3
          volumeMounts:
            - mountPath: /opt/ca-bundle/
              name: ca-bundle
              readOnly: true
      imagePullSecrets:
        - name: dockercfg
      volumes:
        - name: ca-bundle
          configMap:
            name: ca-bundle
Create this job via kubectl create --filename job.yaml and wait for it to complete. Afterwards the
custom report is available in your S3 bucket.
Raw Data
The data used to aggregate the reports can be accessed via the metering Prometheus. If you desire to store this data for longer than 90 days, you need to extract the data from the metering Prometheus and replicate it to a long term storage of your choice.