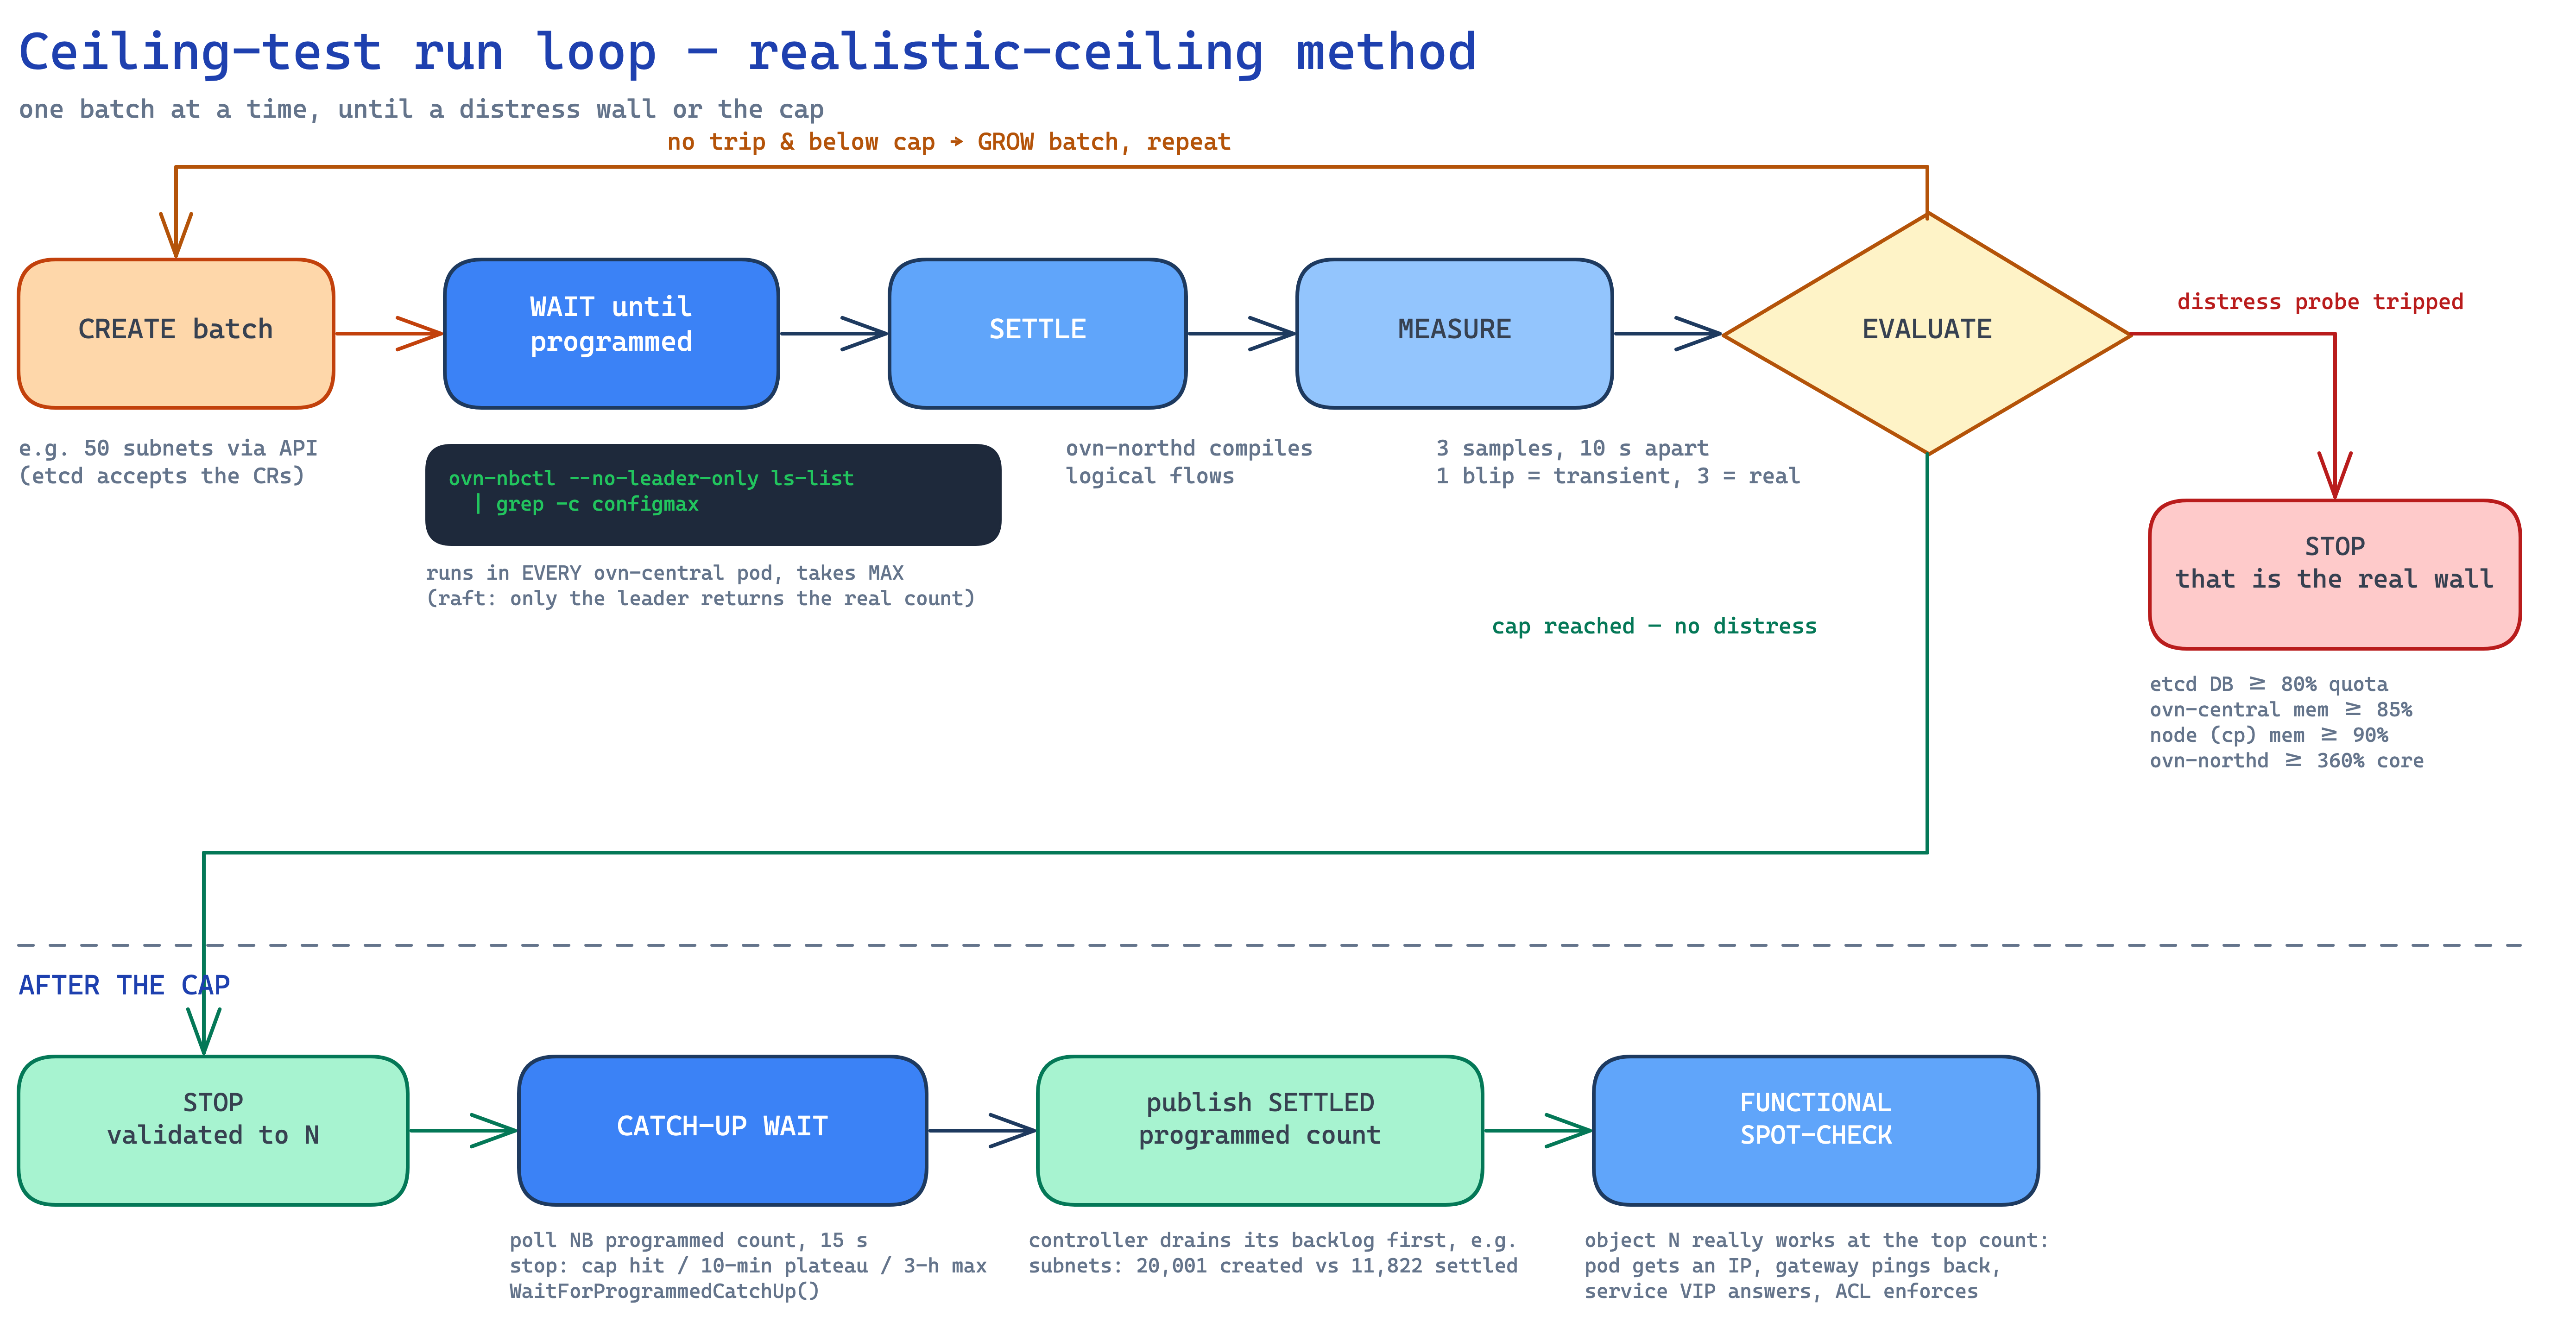
The ceiling of a resource X is the maximum count that stays fully programmed and verified-functional at the same time. The benchmark pushes X up to a configured cap set above the target. The run stops cleanly at the cap, or earlier if a genuine distress signal trips. The result is reported as the highest count that stayed fully programmed and verified functional with no distress observed.
Why this definition. API-accepted counts are misleading: the API accepts nearly unlimited objects, while the network controller programs them into OVN far more slowly. In one controlled measurement, 92,046 subnets were accepted by the API while only about 4,000 were programmed. A pod in subnet number 5,000 would never have received an IP address. Only the programmed count describes capacity a customer can use, which is why every published number is a programmed-and-verified count rather than an API-accepted count.
The measurement loop:
Functional verification. For each resource, the benchmark confirms the objects are functional
rather than merely present. A temporary network-debug pod (netshoot) is placed into a freshly
created subnet and must obtain an IP address and ping its gateway; a service VIP must answer through
live backends;
a firewall rule must demonstrably allow or deny. For additional datapath assurance, the run
spot-checks with the kube-ovn kubectl ko plugin: ko diagnose subnet <name> creates temporary
pods and tests real connectivity, and ko trace proves the allow or drop decision in the datapath
pipeline.
Hygiene. All benchmark objects are fully cleaned up before every run, so one test’s leftovers cannot skew the next test’s baseline. Programmed counts are read from the OVN northbound leader (followers return zero).
Distress probes
A run stops early only on real resource distress, sustained for 3 consecutive samples taken 10 seconds apart:
| Signal | Danger line | What exceeding it means |
|---|---|---|
| etcd database size | 80 % of quota (2 GiB, so about 1.6 GB) | at 100 % etcd goes read-only, causing a cluster-wide write outage |
| ovn-central memory | 85 % of the limit (16 GiB, so about 14.4 GiB) | an OOM-kill triggers a southbound-database replay and minutes of network-control-plane disruption |
| Control-plane node memory | 90 % | the kernel begins OOM-killing pods, which puts the apiserver at risk |
| ovn-northd CPU | 360 % of one core, sustained | steady compile saturation, after which new-workload programming lags |
| Southbound-database size | watched for services runs | growth of the OVN load-balancer table |
| ovs-ovn memory (worst pod per node) | 80 % of the DaemonSet limit (8 GiB, so about 6.6 GiB) | each node’s ovn-controller holds the whole cluster’s logical-flow set, so an OOM-kill here is a per-node datapath wall: no pod on that node can wire until it recovers |
| kube-ovn-controller restarts | at least 1 new restart above the run-start baseline | the controller crashed or was killed mid-run, so the programming throughput from that run is no longer trustworthy |
Probe design notes:
- Fail-closed. A probe that cannot read its metric reports unknown and the run flags it. It never assumes health.
- Sustained, not transient. The ovn-northd CPU threshold targets steady compile saturation. Per-batch compile spikes are expected and are judged only at the settled batch boundary, so a transient spike cannot end a run.
- Restart baseline. The kube-ovn-controller restart probe records the pre-existing restart count at the start of the run and trips only on new restarts, so leftover counts from past incidents on a live cluster never trip a run.
- Tunable. Every threshold can be overridden per run through
distressOverrides(for exampleovsOvnMemoryPct,kubeovnControllerRestarts, andovnCentralMemoryPct).