The KubeLB / Envoy Proxy Grafana dashboard monitors the Envoy proxy instances managed by KubeLB. It is provisioned from the kubelb-manager Helm chart when grafana.dashboards.enabled=true.
Dashboard Overview
Key panels:
- Envoy proxy health and uptime
- Upstream and downstream connection counts
- HTTP request rates, latency distributions, and error ratios
- Cluster and listener configuration state
- Traffic flow breakdown by route
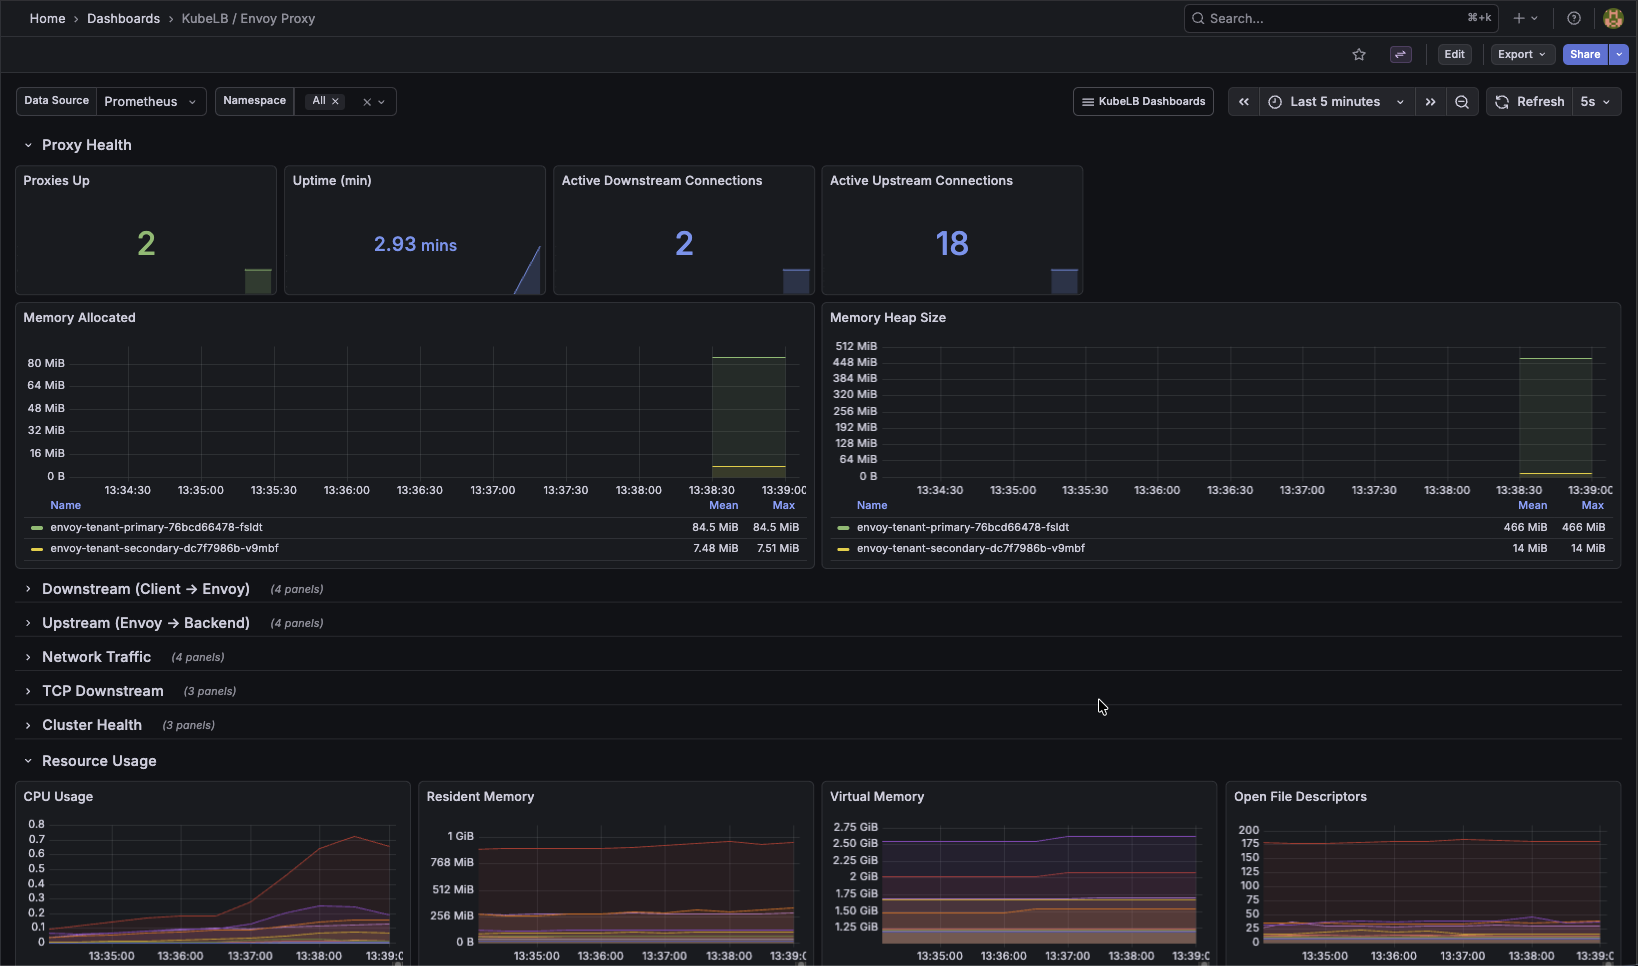
KubeLB Envoy Proxy Dashboard
Envoy Proxy Metrics
The Envoy proxies managed by KubeLB expose their own Prometheus metrics on port 19001 at /stats/prometheus. These pods are pre-configured with Prometheus scraping annotations and provide detailed insight into upstream/downstream connections, HTTP request statistics, and cluster health.
For a full reference of available Envoy metrics, see the Envoy Statistics Overview.
PodMonitor for Envoy Proxy Pods
For environments running the Prometheus Operator, KubeLB can create a PodMonitor that scrapes Envoy Proxy pods directly instead of relying on pod annotations. Use this when scrape annotations aren’t picked up by your Prometheus instance or when you prefer CR-based scrape configuration. Requires the PodMonitor CRD (monitoring.coreos.com/v1) to be installed on the management cluster.
PodMonitor (Envoy Proxy pods) and ServiceMonitor (the kubelb-manager service) are independent switches. Enable either or both depending on what you want to scrape.
Enable via Config CR
Set spec.envoyProxy.podMonitor.enabled on the KubeLB Config:
apiVersion: kubelb.k8c.io/v1alpha1
kind: Config
metadata:
  name: default
  namespace: kubelb
spec:
  envoyProxy:
    podMonitor:
      enabled: true
KubeLB reconciles one PodMonitor named envoy-proxy per tenant namespace (tenant-<name>). The generated resource selects pods with label app.kubernetes.io/name=kubelb-envoy-proxy and scrapes port metrics at path /stats/prometheus.
Enable via Helm values
The kubelb-manager chart exposes the same switch:
# values.yaml
kubelb:
  envoyProxy:
    podMonitor:
      enabled: true
Verify
kubectl get podmonitor -A -l app.kubernetes.io/managed-by=kubelb
Expected output lists one envoy-proxy PodMonitor per tenant namespace:
NAMESPACE      NAME           AGE
tenant-alice   envoy-proxy    1m
tenant-bob     envoy-proxy    1m
Troubleshooting
If Prometheus does not pick up the generated PodMonitors, check that the Prometheus instance’s podMonitorSelector and podMonitorNamespaceSelector match the tenant namespaces and the labels KubeLB sets on the PodMonitor (app.kubernetes.io/name=kubelb-envoy-proxy, app.kubernetes.io/managed-by=kubelb). For kube-prometheus-stack, setting prometheus.prometheusSpec.podMonitorSelectorNilUsesHelmValues=false makes Prometheus discover PodMonitors in all namespaces.
Gateway Observability
For environments using Envoy Gateway and Gateway APIs, the Gateway Observability stack provides a purpose-built monitoring, logging, and alerting setup tailored to Envoy Gateway.
Related
- Envoy Proxy Configuration — configure proxy topology, TLS, and advanced settings