The KubeLB / Envoy Proxy Grafana dashboard monitors the Envoy proxy instances managed by KubeLB. It is provisioned from the kubelb-manager Helm chart when grafana.dashboards.enabled=true.
Dashboard Overview
Key panels:
- Envoy proxy health and uptime
- Upstream and downstream connection counts
- HTTP request rates, latency distributions, and error ratios
- Cluster and listener configuration state
- Traffic flow breakdown by route
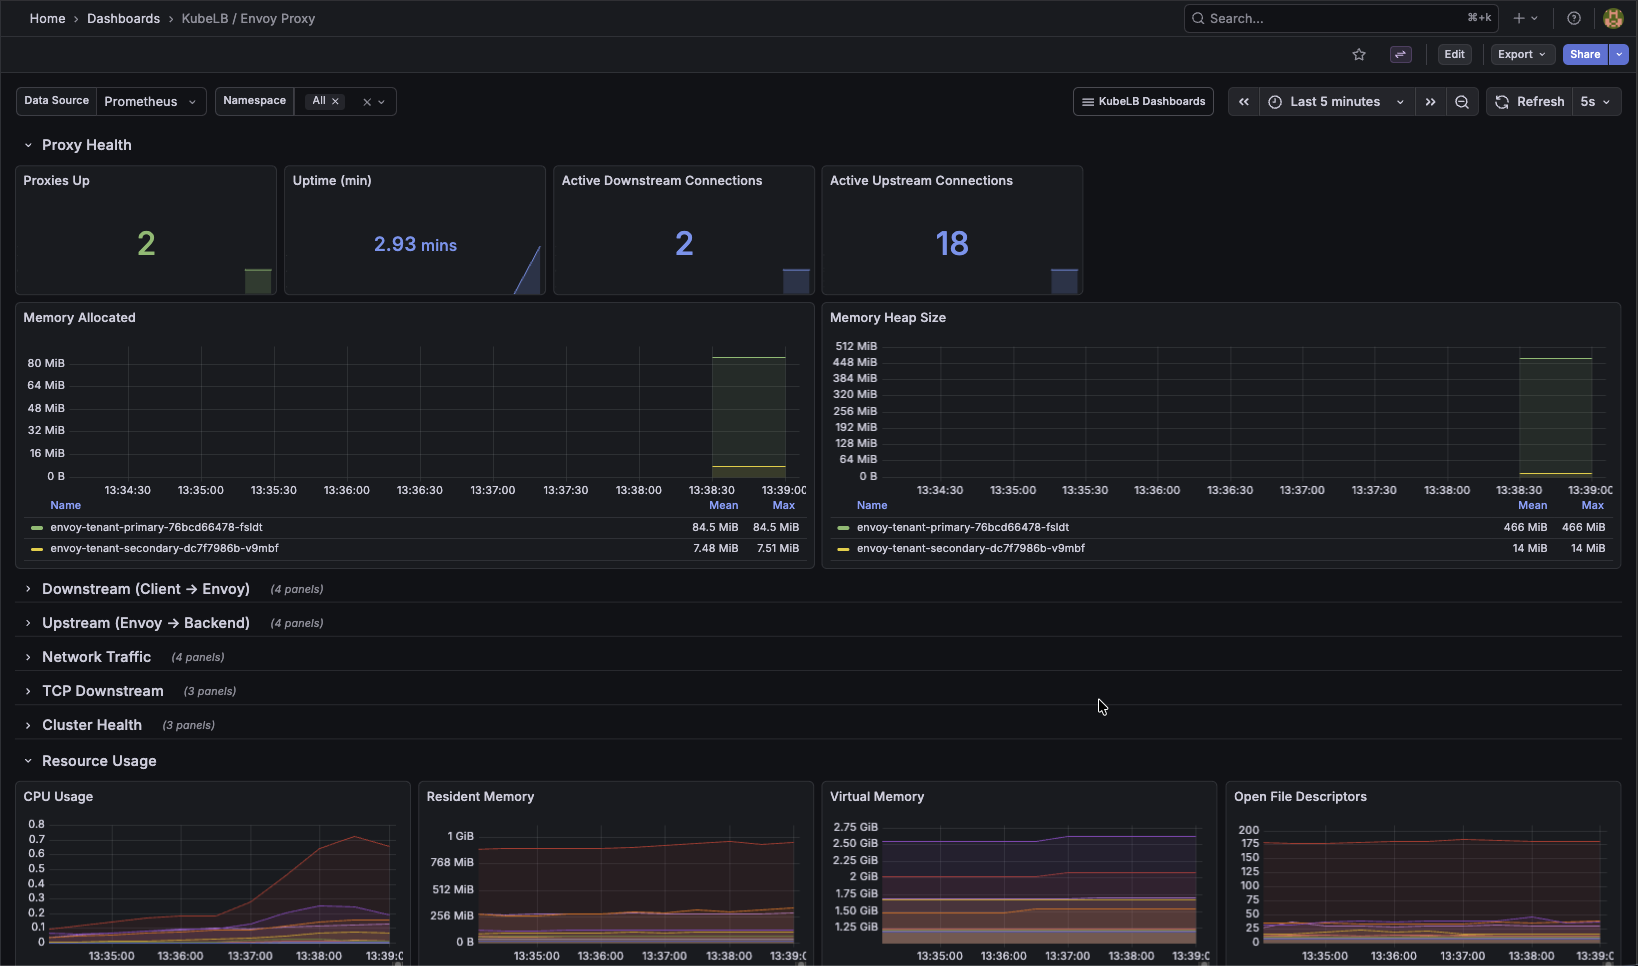
KubeLB Envoy Proxy Dashboard
Envoy Proxy Metrics
The Envoy proxies managed by KubeLB expose their own Prometheus metrics on port 19001 at /stats/prometheus. These pods are pre-configured with Prometheus scraping annotations and provide detailed insight into upstream/downstream connections, HTTP request statistics, and cluster health.
For a full reference of available Envoy metrics, see the Envoy Statistics Overview.
Gateway Observability
For environments using Envoy Gateway and Gateway APIs, the Gateway Observability stack provides a purpose-built monitoring, logging, and alerting setup tailored to Envoy Gateway.
Related
- Envoy Proxy Configuration — configure proxy topology, TLS, and advanced settings