Overview
KubeLB Dashboard is the web UI for KubeLB. A single chart and binary cover both Community Edition and Enterprise Edition; there is no separate EE build. Source code and upstream documentation are at kubermatic/kubelb-dashboard.
The dashboard browses tenants, LoadBalancers, Routes, and Gateway API resources, and renders a live traffic graph, per-proxy metrics, and Kubernetes events on detail pages, plus a read-only AI & MCP gateway view on clusters running the agentgateway addon. Enterprise Edition adds WAF policy management.
Prerequisites
- A running KubeLB management cluster with the KubeLB Manager installed; see
the installation guide. The dashboard is
deployed alongside the manager in the
kubelbnamespace. - A Gateway (Gateway API) or Ingress controller on the management cluster to expose the dashboard.
- Optional: a Hubble Relay for the Traffic view and a Prometheus that scrapes the KubeLB Envoy proxies for the Metrics tab.
Screenshots
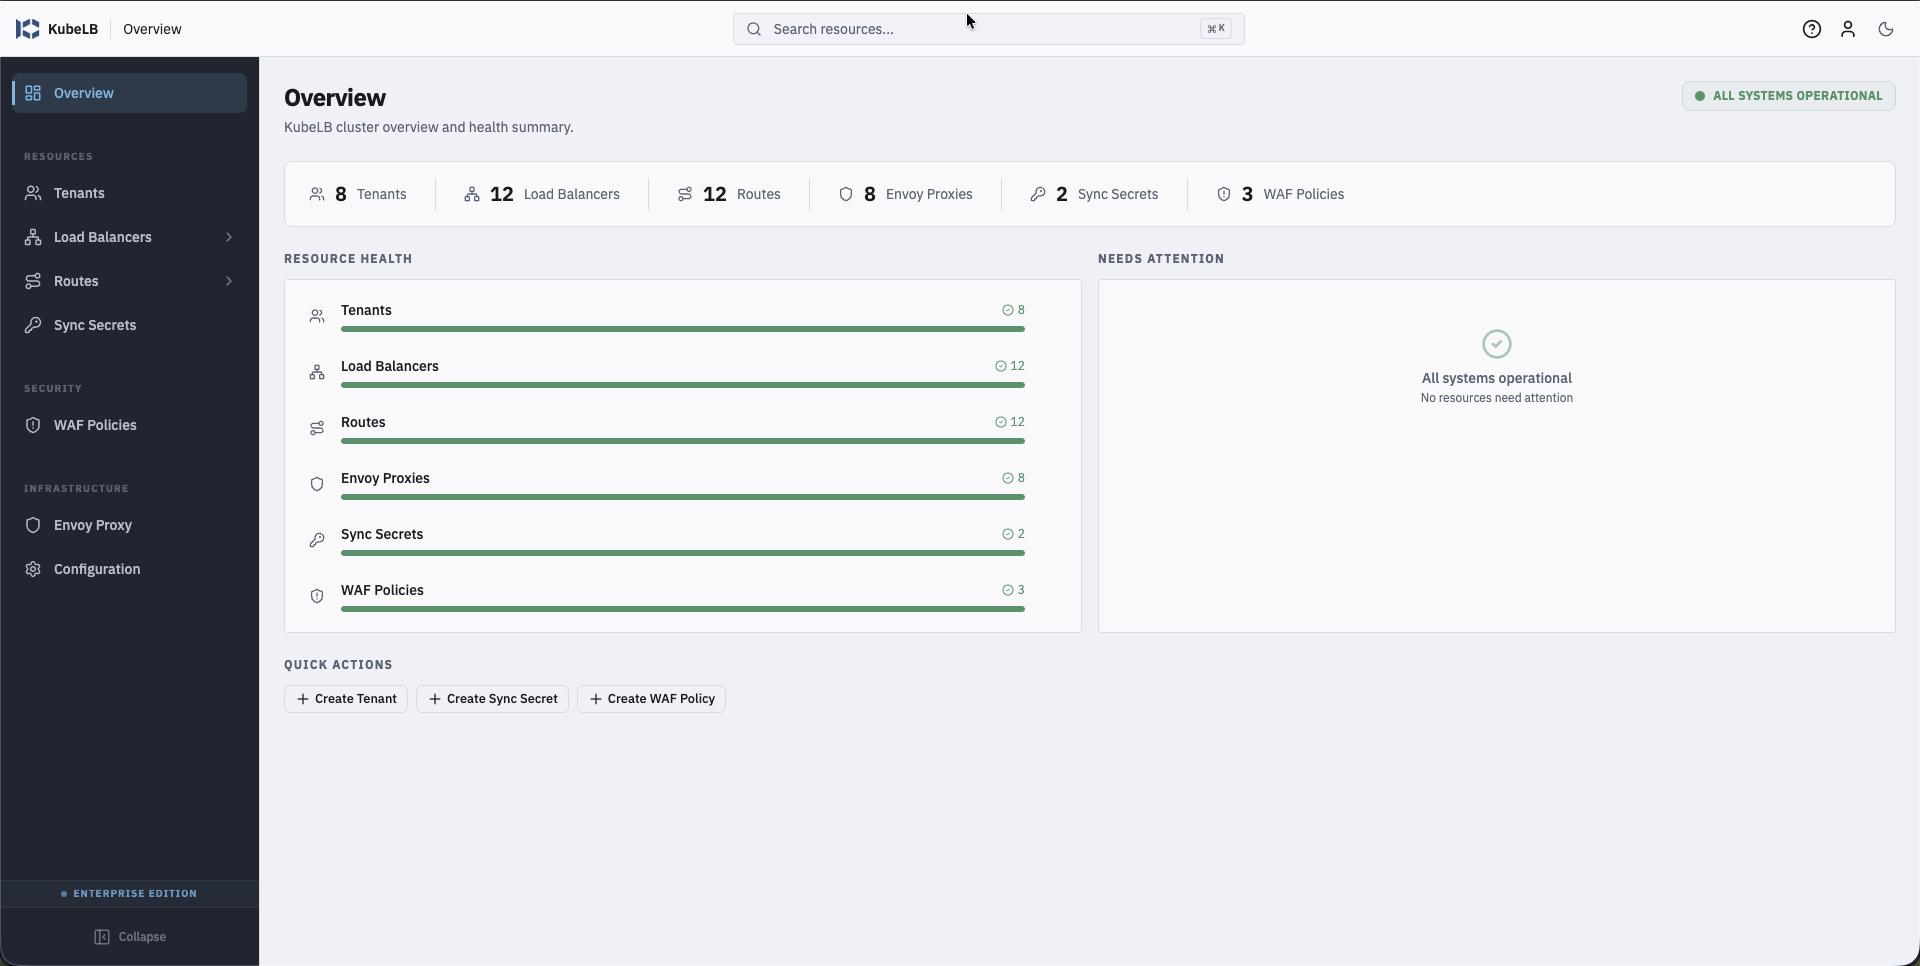
Cluster overview with resource counts and health.
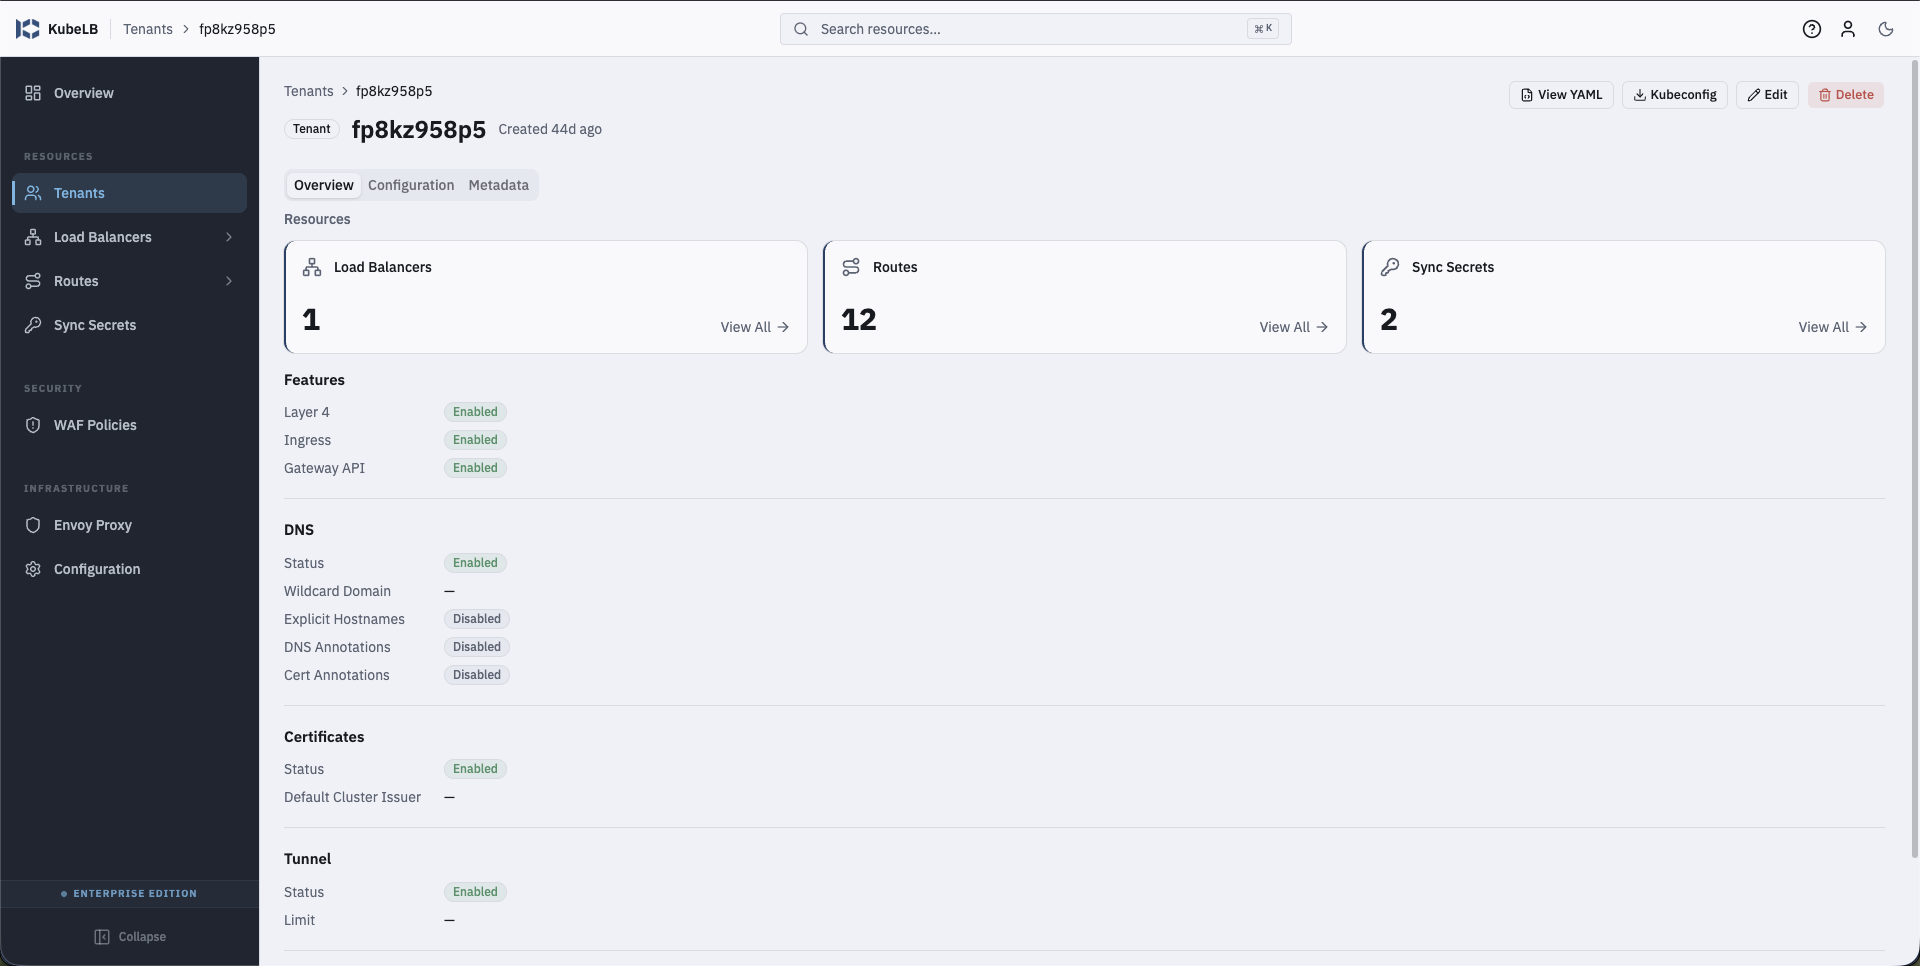
Tenant detail showing enabled features, DNS, certificates, and tunnel configuration.
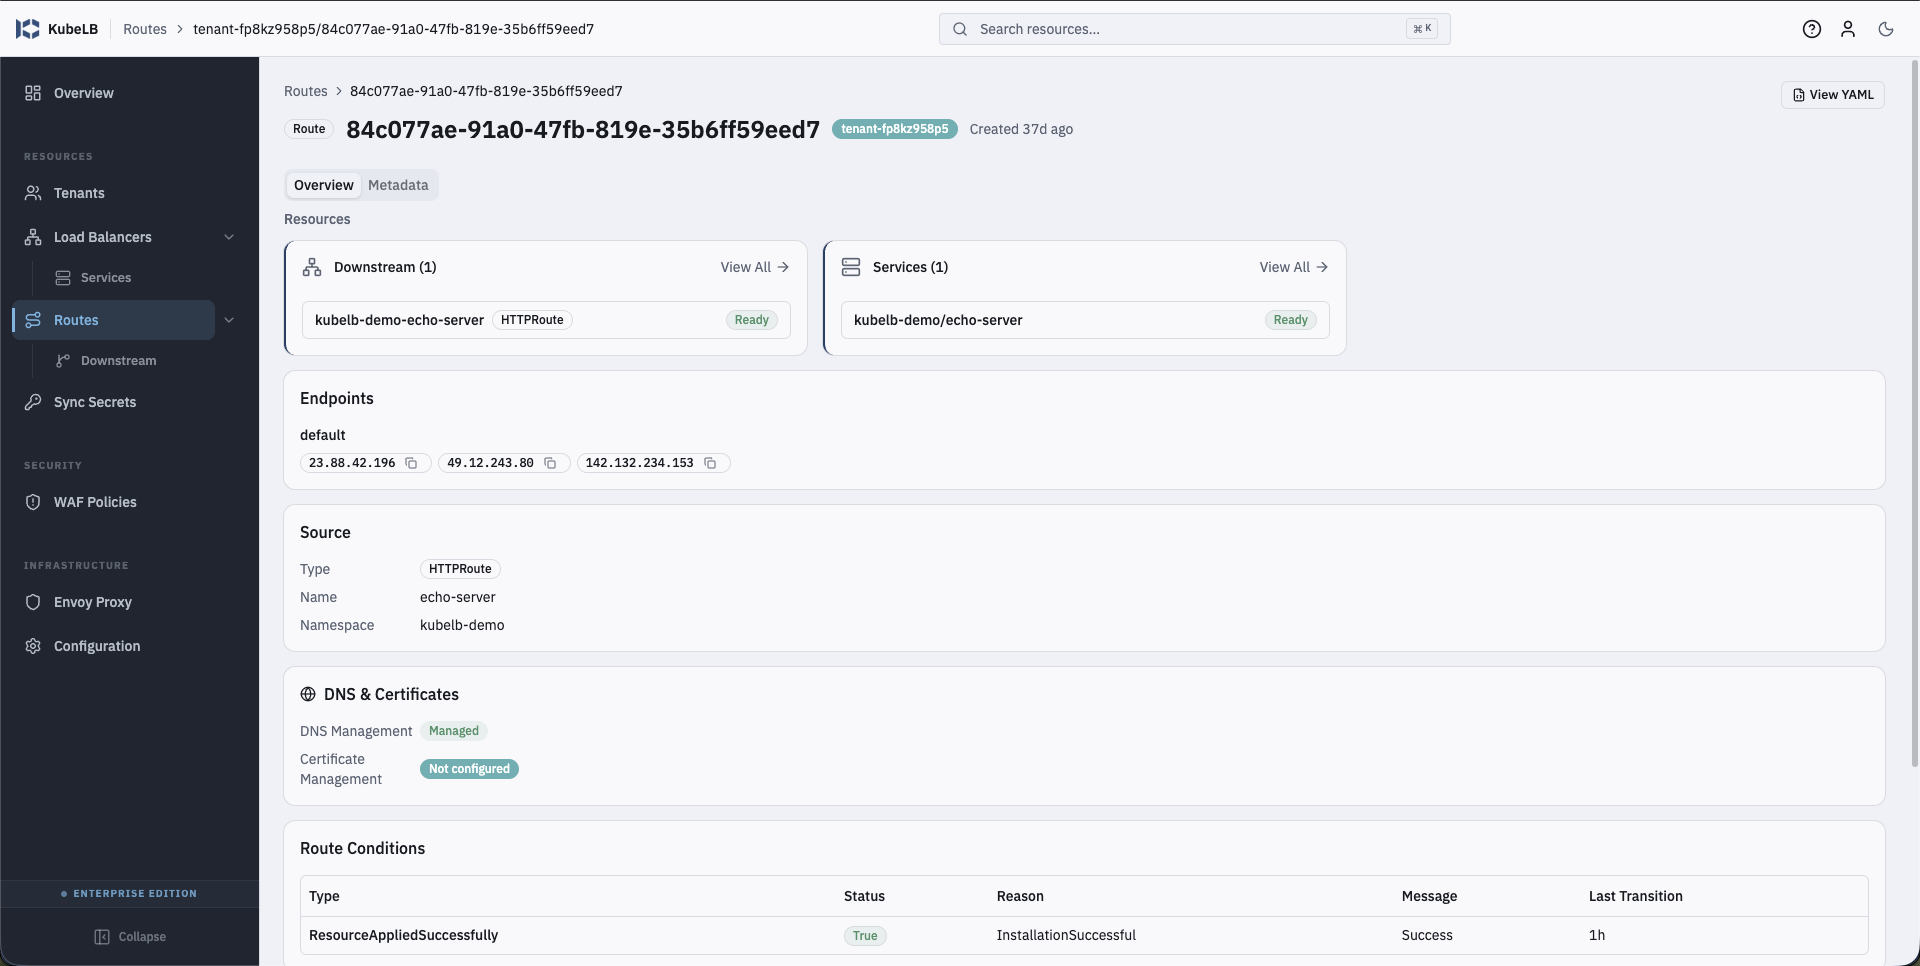
Route detail with endpoints, source, DNS/certificate state, and route conditions.
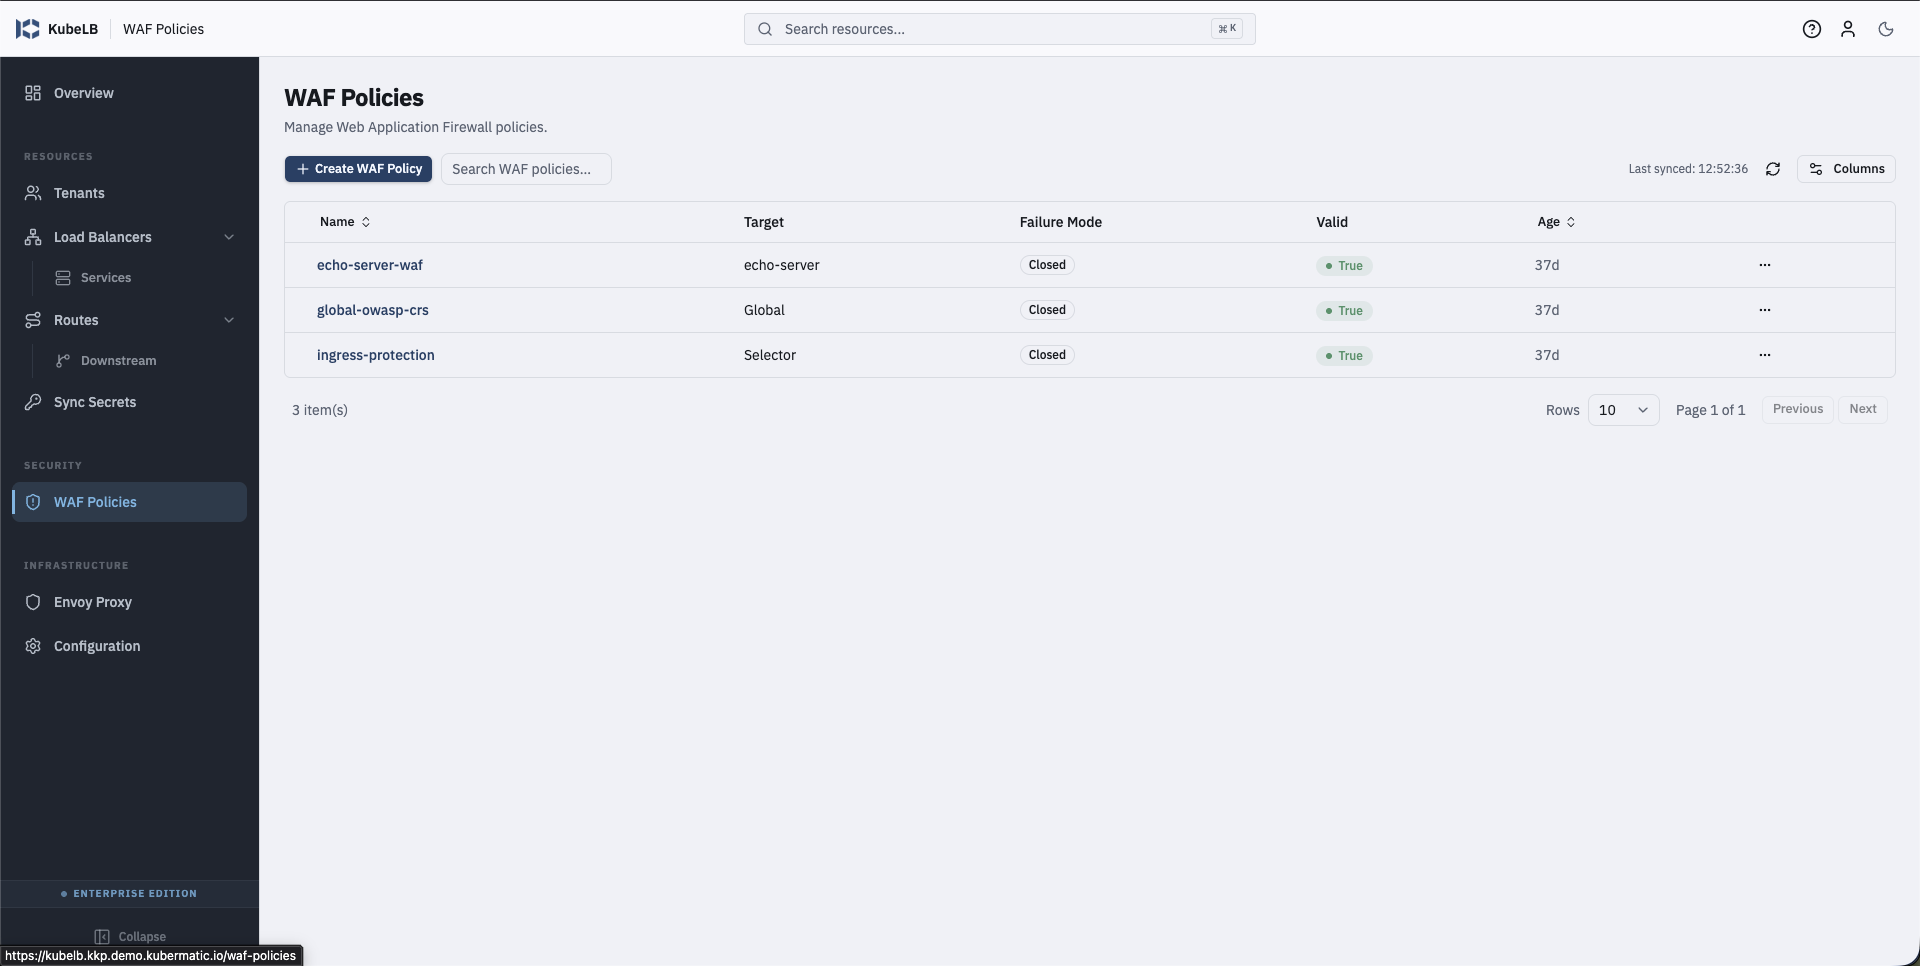
WAF policies list (Enterprise Edition).
Install
Install the dashboard from the Kubermatic OCI registry:
helm upgrade kubelb-dashboard \
  oci://quay.io/kubermatic/helm-charts/kubelb-dashboard \
  --version v1.1.0 \
  --namespace kubelb --create-namespace --install
The dashboard is deployed alongside the KubeLB Manager in the kubelb
namespace on the management cluster.
Expose via HTTPRoute
Enable the chart’s built-in HTTPRoute (Gateway API v1) with --set flags. It
is independent of ingress.enabled; both may be enabled simultaneously.
helm install kubelb-dashboard oci://quay.io/kubermatic/helm-charts/kubelb-dashboard \
  --set httpRoute.enabled=true \
  --set httpRoute.parentRefs[0].name=kubelb \
  --set httpRoute.parentRefs[0].namespace=kubelb \
  --set httpRoute.hostnames[0]=app.example.com
Equivalent values.yaml:
httpRoute:
  enabled: true
  parentRefs:
    - name: kubelb
      namespace: kubelb
  hostnames:
    - app.example.com
parentRefs must point at an existing Gateway. Omitting httpRoute.rules
routes PathPrefix / to the dashboard Service on service.port; override
rules for custom matches or backends.
Expose via Ingress
Enable the chart’s built-in Ingress with --set flags:
helm install kubelb-dashboard oci://quay.io/kubermatic/helm-charts/kubelb-dashboard \
  --set ingress.enabled=true \
  --set ingress.className=nginx \
  --set ingress.hosts[0].host=app.example.com \
  --set ingress.hosts[0].paths[0].path=/ \
  --set ingress.hosts[0].paths[0].pathType=Prefix
Equivalent values.yaml:
ingress:
  enabled: true
  className: nginx
  hosts:
    - host: app.example.com
      paths:
        - path: /
          pathType: Prefix
For TLS termination, pair the Ingress with
cert-manager and populate ingress.tls and
ingress.annotations accordingly.
Editions
The edition is detected at runtime by probing for the wafpolicies CRD, which
is present in Enterprise Edition and absent in Community Edition. On Community
Edition the Enterprise-only navigation entries and detail-page sections are
hidden; on Enterprise Edition they appear automatically.
| Capability | Community | Enterprise |
|---|---|---|
| Tenants, LoadBalancers, Routes, Gateway API | ✓ | ✓ |
| Traffic view, Metrics, Events, Watch | ✓ | ✓ |
| WAF policy management | ✓ | |
| AI & MCP gateways | ✓ * | ✓ * |
| Tenant tunnel / circuit-breaker / limit fields | ✓ |
* AI & MCP gateways additionally require the agentgateway addon; see below.
Traffic View (Hubble)
The Traffic view renders a live service-to-service graph and an accompanying
flow table sourced from Cilium Hubble.
Select a time window (1m, 5m, 15m, or 1h), filter flows, and open a
per-proxy subgraph to focus on the traffic handled by a single KubeLB Envoy
proxy. A detail panel breaks down the selected edge or flow.
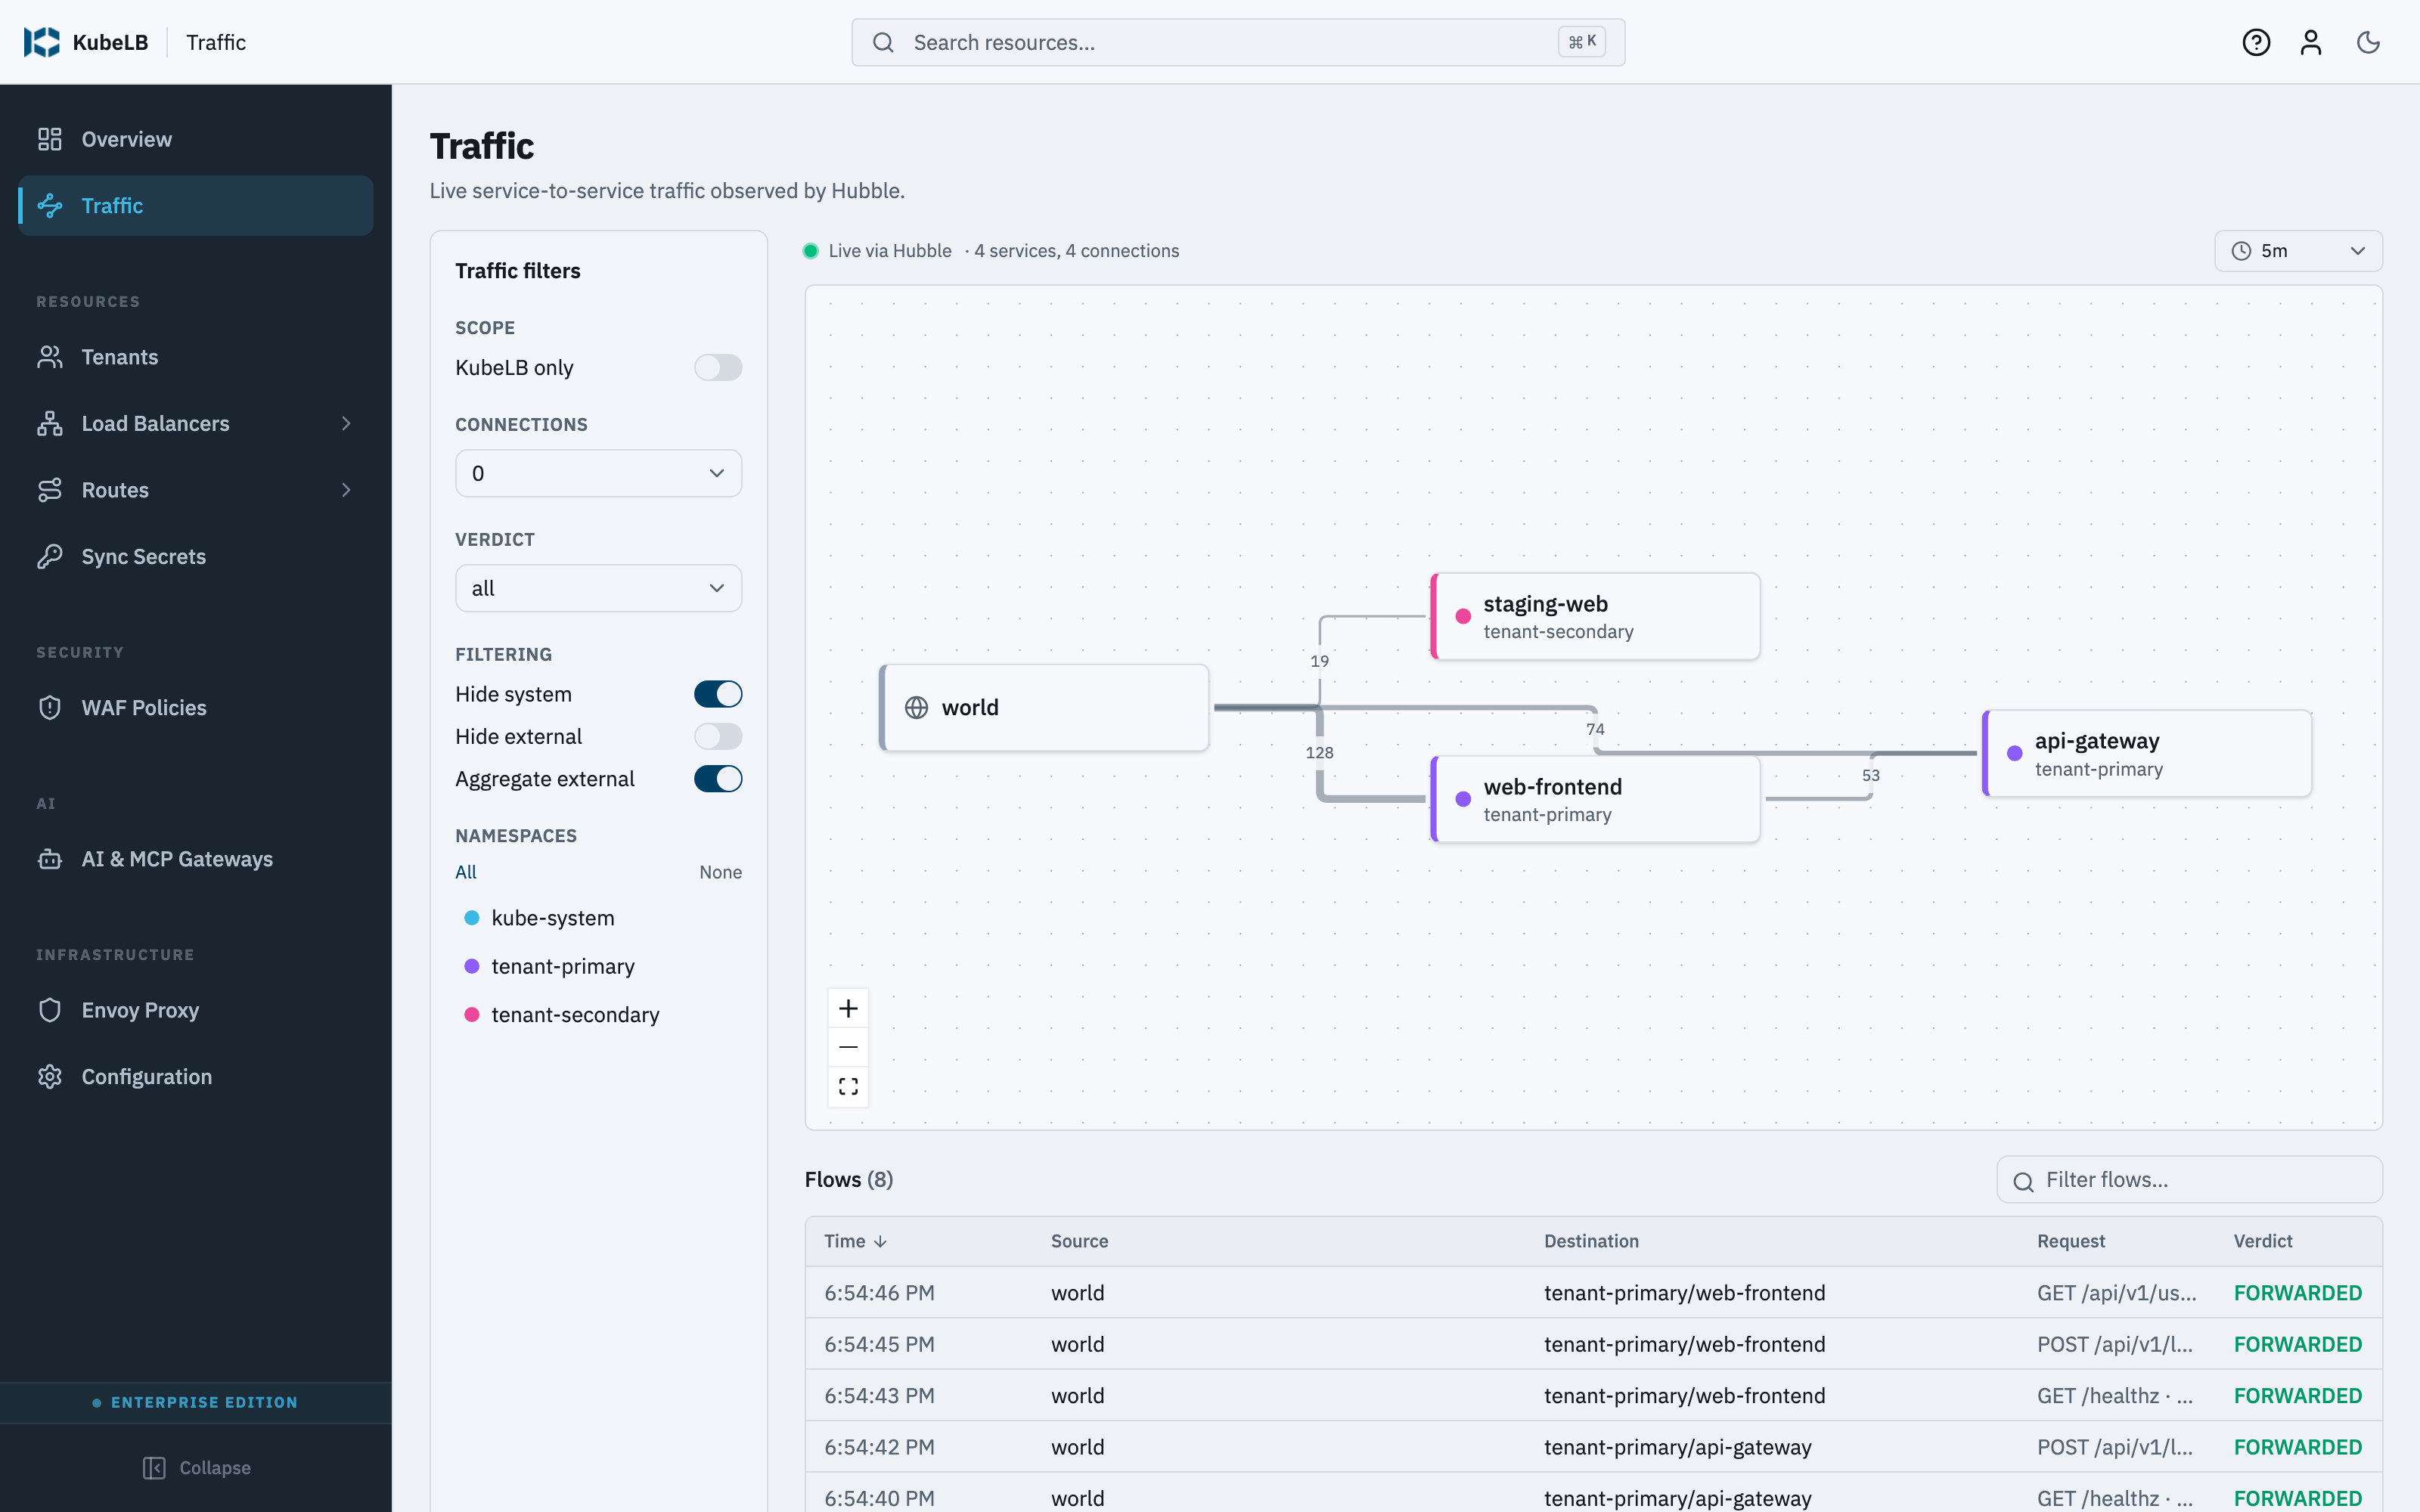
Point the dashboard at the Hubble Relay gRPC endpoint:
traffic:
  hubbleRelayAddress: hubble-relay.kube-system.svc:80
The Traffic view is capability-gated: when no Hubble Relay is reachable, the
view is hidden entirely. When the relay is served over mTLS on port 443, the
dashboard loads client certificates automatically during
auto-discovery; for a TLS relay on a non-standard
port, set an explicit address and supply the certificate material through the
HUBBLE_RELAY_TLS_* environment variables.
Metrics (Prometheus)
The Metrics tab on an Envoy Proxy detail page shows per-proxy metrics (request rate, 5xx errors, p99 latency, and active connections) computed from the Envoy series scraped by Prometheus.

Point the dashboard at a Prometheus that scrapes the KubeLB Envoy proxies:
metrics:
  prometheusUrl: http://prometheus.monitoring.svc:9090
Metrics are capability-gated: if Prometheus is unreachable or does not expose
the Envoy series, the Metrics tab is absent entirely rather than showing an
error. Auto-discovery only finds a Prometheus
listening on the standard port 9090; for any other port, set
metrics.prometheusUrl explicitly. The API templates all PromQL
server-side from a fixed set of named queries. The browser never sends raw
PromQL, so the dashboard cannot be used as an open Prometheus proxy.
Observability Auto-Discovery
Auto-discovery is an upcoming feature. It is available on the dashboard main
branch and ships in a future release; the traffic.autoDiscover and
metrics.autoDiscover values are no-ops on older dashboard images.
When traffic.hubbleRelayAddress and metrics.prometheusUrl are left empty,
the API discovers the in-cluster observability backends itself:
- Hubble Relay: the API looks for a Service labelled
k8s-app=hubble-relayin any namespace, falling back to a Service namedhubble-relayinkube-systemorcilium. A relay on port443is treated as mTLS and its client certificates are loaded from thehubble-relay-client-certsSecret. - Prometheus: the API probes well-known Prometheus and VictoriaMetrics Service locations and selects the first one that exposes the Envoy series the metrics panels need.
Discovery goes through Services only, never Pods, so it needs no RBAC beyond
what the chart already grants (cluster-wide read on services, secrets, and
namespaces). An explicitly configured address always wins over discovery.
While a source stays unavailable, the API re-checks every 5 minutes, so a
cluster that installs Prometheus or Hubble later is picked up without a
restart.
Auto-discovery is enabled by default. To pin the dashboard to explicitly configured endpoints, disable it:
traffic:
  autoDiscover: false
metrics:
  autoDiscover: false
Events
Resource detail pages list the Kubernetes Events associated with the object, so you can see the recent reconcile activity for a tenant, LoadBalancer, or Route without leaving the dashboard.

Watch Streaming
By default the dashboard polls resource lists every 15 seconds. Enable Kubernetes watch streaming to receive updates as they happen:
watch:
  enabled: true
Enable watch streaming per deployment once validated against your cluster. If a watch stream fails, the dashboard falls back to polling.
Watch streams are long-lived HTTP connections, so whatever fronts the dashboard must allow them. On the default Envoy Gateway path the dashboard HTTPRoute sets no timeout, and Envoy’s 15-second default request timeout kills every stream: the dashboard silently falls back to polling and logs reconnect noise. Set explicit timeouts on the dashboard HTTPRoute rule (the same values the connection-manager route uses):
spec:
  rules:
    - timeouts:
        request: 3600s
        backendRequest: 3600s
Read-Only Mode
Run the dashboard in read-only mode to disable all mutating operations:
readOnly: true
In this mode the API rejects mutating requests to the Kubernetes API and the UI
hides every create, edit, and delete control. When rbac.create is true, the
generated ClusterRole is additionally narrowed to read-only verbs
(get, list, watch) as defense-in-depth.
AI & MCP Gateways
On clusters running the agentgateway addon, an AI Gateway view lists
AgentgatewayBackend resources read-only. It surfaces the configured LLM
providers and models (OpenAI, Anthropic, Gemini, Mistral, Ollama) and any
federated MCP tool servers. Provider and auth credentials are shown by name
only; secret values are never displayed.
This view is gated on discovery of the agentgatewaybackends.agentgateway.dev
CRD, independently of the WAF-based edition signal, so any cluster running the
agentgateway addon gets the view whether or not the WAF addon is installed.
WAF Policies (Enterprise Edition)
Enterprise Edition adds a WAF Policies page (shown in the
screenshots above) with full create, read, update, and delete
support for WAFPolicy resources.
OIDC Authentication
OIDC is off by default. The underlying API reads the following environment variables:
| Variable | Required | Default | Description |
|---|---|---|---|
OIDC_ISSUER | Yes | — | OIDC provider issuer URL (e.g. https://dex.example.com) |
OIDC_CLIENT_ID | Yes | — | OIDC client ID |
OIDC_CLIENT_SECRET | Yes | — | OIDC client secret |
SESSION_SECRET | Yes | — | 32+ char secret for encrypting session cookies |
OIDC_REDIRECT_URI | No | http://localhost:{PORT}/auth/callback | Callback URL registered with IdP |
OIDC_SCOPES | No | openid email profile groups offline_access | Space-separated scopes |
SESSION_MAX_AGE | No | 86400 (24h) | Session cookie max age in seconds |
All four required variables must be set together. A partial configuration exits with an error. If none are set, the dashboard runs without authentication.
Enable OIDC via values.yaml:
auth:
  enabled: true
  oidc:
    issuerUrl: https://dex.example.com
    clientId: kubelb-dashboard
  existingSecret: kubelb-dashboard-auth
In production, supply clientSecret and sessionSecret through
auth.existingSecret rather than inline values, so secret material stays out
of the values file.
Kubernetes API Access
The dashboard proxies requests to the Kubernetes API through the API server.
By default only an allowlist of paths is permitted: the resource groups the
dashboard renders (kubelb.k8c.io, apps, networking.k8s.io, the
Gateway API groups, agentgateway.dev, and core namespaces/services/
secrets/events), plus CRD discovery. Pod exec, attach, portforward,
and proxy subresources are always blocked, as are paths containing .. or
%.
The allowlist is the recommended posture. It can be disabled with the
KUBE_PROXY_ALLOWLIST_DISABLED=true
environment variable; do this only when you
deliberately need broader proxy access, since it removes a defense-in-depth
boundary.
Configuration Reference
Helm Values
Feature-related values (see the chart README for the complete list):
| Value | Default | Description |
|---|---|---|
readOnly | false | Disable all mutating operations and narrow the ClusterRole to read-only verbs |
watch.enabled | false | Stream resource-list updates instead of polling every 15s |
metrics.prometheusUrl | "" | Prometheus base URL that scrapes the KubeLB Envoy proxies |
metrics.autoDiscover | true | Auto-discover Prometheus when prometheusUrl is empty (explicit URL always wins) |
traffic.hubbleRelayAddress | "" | Hubble Relay gRPC address, e.g. hubble-relay.kube-system.svc:80 |
traffic.autoDiscover | true | Auto-discover Hubble Relay when hubbleRelayAddress is empty (explicit wins) |
rbac.create | true | Create the ClusterRole and ClusterRoleBinding the API needs |
auth.enabled | false | Enable OIDC authentication |
Environment Variable Reference
The API server reads the following variables. Most are set for you by the chart from the values above; the ones marked env-only are not surfaced as chart values and must be set directly on the API container when needed.
| Variable | Default | Set by | Description |
|---|---|---|---|
PORT | 3001 | image | API server listen port |
READ_ONLY | false | readOnly | Reject mutating requests and hide write controls |
WATCH_ENABLED | false | watch.enabled | Stream list updates instead of polling |
PROMETHEUS_URL | — | metrics.prometheusUrl | Prometheus base URL for per-proxy metrics |
PROMETHEUS_AUTODISCOVER | true | metrics.autoDiscover | Auto-discover Prometheus when PROMETHEUS_URL is unset |
HUBBLE_RELAY_ADDRESS | — | traffic.hubbleRelayAddress | Hubble Relay gRPC address for the Traffic view |
HUBBLE_AUTODISCOVER | true | traffic.autoDiscover | Auto-discover Hubble Relay when HUBBLE_RELAY_ADDRESS is unset |
HUBBLE_RELAY_TLS_CA | — | env-only | CA certificate (PEM) for an mTLS Hubble Relay |
HUBBLE_RELAY_TLS_CERT | — | env-only | Client certificate (PEM) for an mTLS Hubble Relay |
HUBBLE_RELAY_TLS_KEY | — | env-only | Client key (PEM) for an mTLS Hubble Relay |
HUBBLE_RELAY_TLS_SERVER_NAME | — | env-only | Override the TLS server name when verifying the relay certificate |
KUBE_PROXY_ALLOWLIST_DISABLED | false | env-only | Disable the Kubernetes API path allowlist |
KUBECONFIG | — | kubeconfig.existingSecret | Path to a mounted kubeconfig for out-of-cluster access |
OIDC and session variables are documented under OIDC Authentication.
Kubeconfig (optional)
For out-of-cluster access to the KubeLB management API, mount a kubeconfig through an existing Secret:
kubeconfig:
  existingSecret: kubelb-dashboard-kubeconfig
  key: kubeconfig
kubeconfig.key is the key inside the Secret that holds the kubeconfig file
(default kubeconfig). Leave kubeconfig.existingSecret empty to use the
in-cluster service account.